This is how I was able to move the legend to a particular place inside the plot and change the aspect and size of the plot:
import matplotlib
matplotlib.use('Agg')
import matplotlib.pyplot as plt
matplotlib.style.use('ggplot')
import seaborn as sns
sns.set(style="ticks")

figure_name = 'rater_violinplot.png'
figure_output_path = output_path + figure_name

viol_plot = sns.factorplot(x="Rater",
                       y="Confidence",
                       hue="Event Type",
                       data=combo_df,
                       palette="colorblind",
                       kind='violin',
                       size = 10,
                       aspect = 1.5,
                       legend=False)

viol_plot.ax.legend(loc=2)
viol_plot.fig.savefig(figure_output_path)
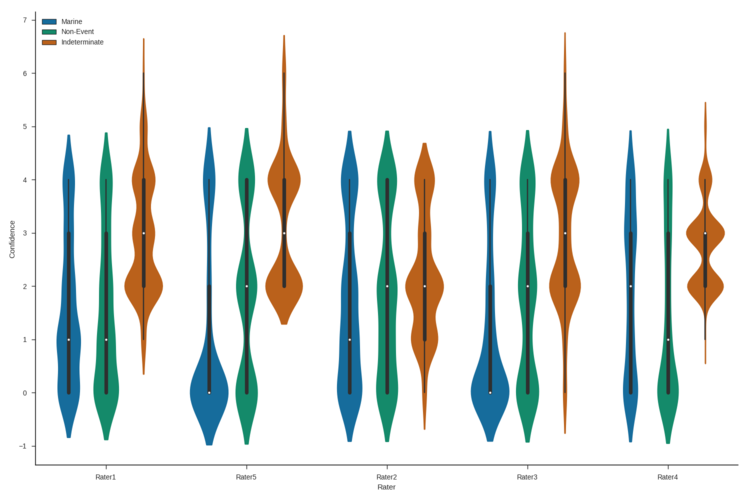
![Legend location changed]()
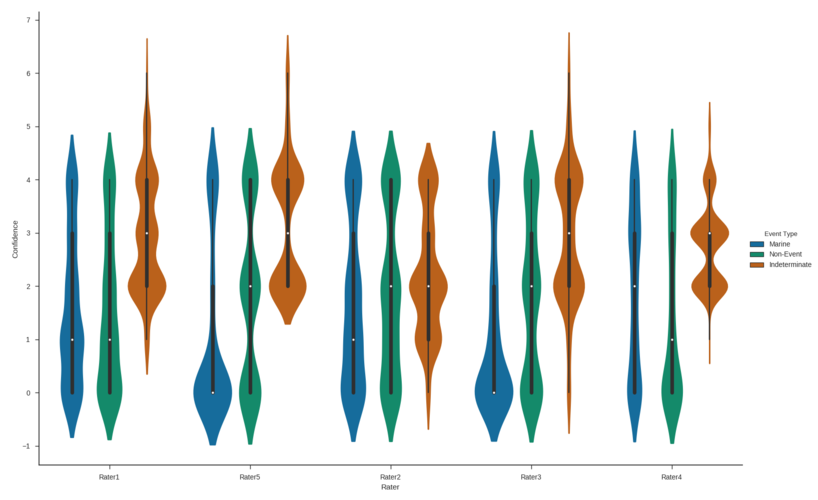
This worked for me to change the size and aspect of the plot as well as move the legend outside the plot area.
import matplotlib
matplotlib.use('Agg')
import matplotlib.pyplot as plt
matplotlib.style.use('ggplot')
import seaborn as sns
sns.set(style="ticks")


figure_name = 'rater_violinplot.png'
figure_output_path = output_path + figure_name

viol_plot = sns.factorplot(x="Rater",
                       y="Confidence",
                       hue="Event Type",
                       data=combo_df,
                       palette="colorblind",
                       kind='violin',
                       size = 10,
                       aspect = 1.5,
                       legend_out=True)

viol_plot.fig.savefig(figure_output_path)
![violin plot with changed size, aspect and legend located outside]()
I figured this out from mwaskom's answer here and Fernando Hernandez's answer here.


seaborn >= 0.11.2use.move_legendas shown in this answer – Settler