Savefig outputs blank image
Asked Answered
E

5

348

I am trying to save plots I make using matplotlib; however, the images are saving blank.

Here is my code:

plt.subplot(121)
plt.imshow(dataStack, cmap=mpl.cm.bone)

plt.subplot(122)
y = copy.deepcopy(tumorStack)
y = np.ma.masked_where(y == 0, y)

plt.imshow(dataStack, cmap=mpl.cm.bone)
plt.imshow(y, cmap=mpl.cm.jet_r, interpolation='nearest')

if T0 is not None:
    plt.subplot(123)
    plt.imshow(T0, cmap=mpl.cm.bone)

    #plt.subplot(124)
    #Autozoom

#else:
    #plt.subplot(124)
    #Autozoom

plt.show()
plt.draw()
plt.savefig('tessstttyyy.png', dpi=100)

And tessstttyyy.png is blank (also tried with .jpg)

Ermelindaermengarde answered 26/1, 2012 at 0:30 Comment(0)
A
501

First, what happens when T0 is not None? I would test that, then I would adjust the values I pass to plt.subplot(); maybe try values 131, 132, and 133, or values that depend whether or not T0 exists.

Second, after plt.show() is called, a new figure is created. To deal with this, you can

  1. Call plt.savefig('tessstttyyy.png', dpi=100) before you call plt.show()

  2. Save the figure before you show() by calling plt.gcf() for "get current figure", then you can call savefig() on this Figure object at any time.

For example:

fig1 = plt.gcf()
plt.show()
plt.draw()
fig1.savefig('tessstttyyy.png', dpi=100)

In your code, 'tesssttyyy.png' is blank because it is saving the new figure, to which nothing has been plotted.

Amador answered 26/1, 2012 at 1:5 Comment(6)
Forgot to remove the T0 part...it was commented previously.Ermelindaermengarde
A special case of this occurs in jupyter notebooks with %matplotlib inline enabled: the savefig call must be in the same cell as the plot creation method.Ovule
Interesting to see plt.show() generates a new image. Indeed, this solved the issue.Oren
Interestingly, if you type plt.plot, plt.savefig, plt.show one by one in terminal such as spyder, it will not show fig. Put all command in a script and run in one go. It shows the plot.Trio
@Trio Hi. Do you happen to know why this happens? I was thinking it's actually a problem that causes functions like plt.ylabel() create a new figure instead of applying to the current one (posted here), and also saving figures blank. I plotted a figure and saved it in the same line (separated by ;) and it worked. Is this just a problem with Spyder?Heinz
I've tried all answers in this post and still nothing works. It runs without errors and creates the file just fineFavour
K
268

plt.show() should come after plt.savefig()

Explanation: plt.show() clears the whole thing, so anything afterwards will happen on a new empty figure

Kirstinkirstyn answered 17/11, 2017 at 3:57 Comment(0)
B
37

change the order of the functions fixed the problem for me:

  • first Save the plot
  • then Show the plot

as following:

plt.savefig('heatmap.png')

plt.show()
Brenan answered 7/8, 2019 at 16:4 Comment(0)
D
7

Calling savefig before show() worked for me.

fig ,ax = plt.subplots(figsize = (4,4))
sns.barplot(x='sex', y='tip', color='g', ax=ax,data=tips)
sns.barplot(x='sex', y='tip', color='b', ax=ax,data=tips)
ax.legend(['Male','Female'], facecolor='w')

plt.savefig('figure.png')
plt.show()
Dimerous answered 7/12, 2019 at 7:30 Comment(0)
H
3

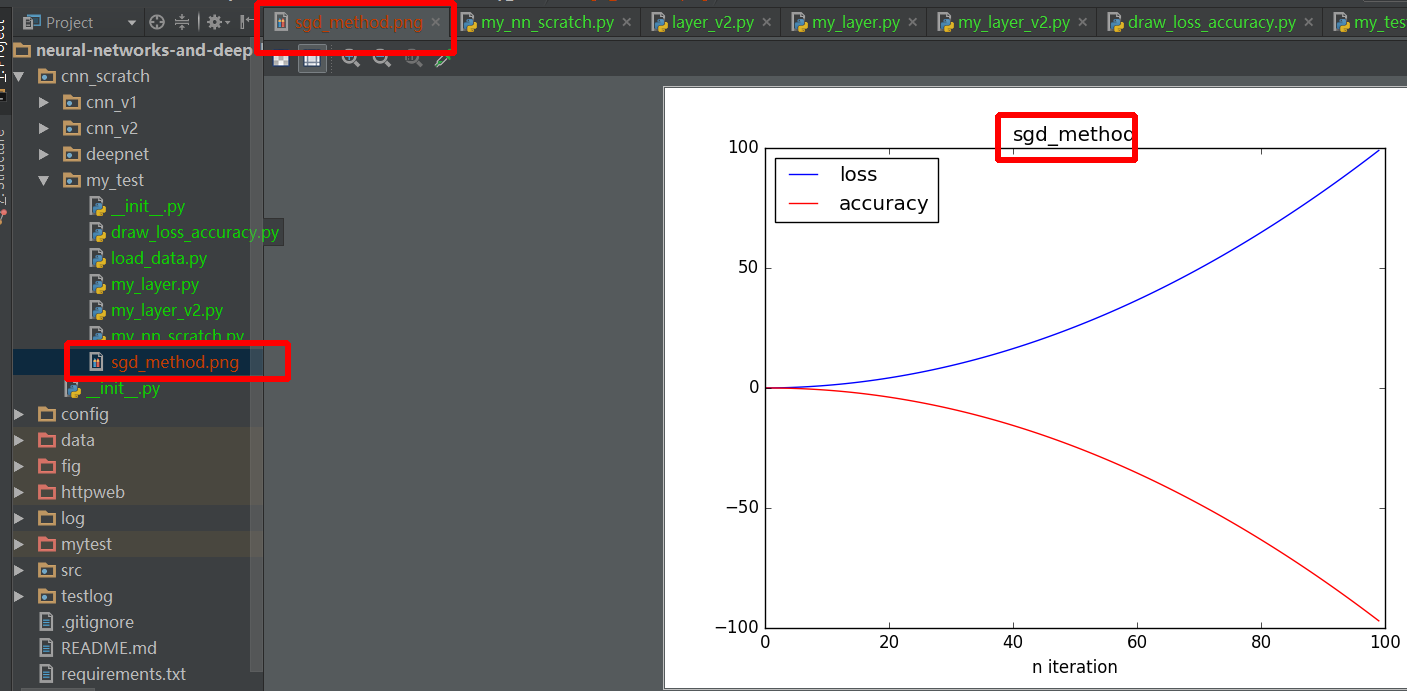
let's me give a more detail example:

import numpy as np
import matplotlib.pyplot as plt


def draw_result(lst_iter, lst_loss, lst_acc, title):
    plt.plot(lst_iter, lst_loss, '-b', label='loss')
    plt.plot(lst_iter, lst_acc, '-r', label='accuracy')

    plt.xlabel("n iteration")
    plt.legend(loc='upper left')
    plt.title(title)
    plt.savefig(title+".png")  # should before plt.show method

    plt.show()


def test_draw():
    lst_iter = range(100)
    lst_loss = [0.01 * i + 0.01 * i ** 2 for i in xrange(100)]
    # lst_loss = np.random.randn(1, 100).reshape((100, ))
    lst_acc = [0.01 * i - 0.01 * i ** 2 for i in xrange(100)]
    # lst_acc = np.random.randn(1, 100).reshape((100, ))
    draw_result(lst_iter, lst_loss, lst_acc, "sgd_method")


if __name__ == '__main__':
    test_draw()

enter image description here

Hake answered 20/7, 2018 at 9:33 Comment(0)

© 2022 - 2024 — McMap. All rights reserved.