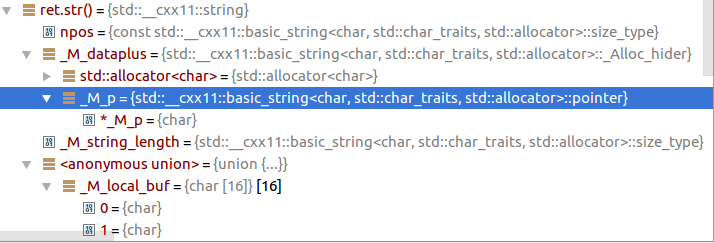
I'm using CLion on Linux and having difficulties with debugging. I evaluated an expression which ends up being a string, but the debugger is useless at showing me what the return value is, other than that it is a string. How do I see the actual value? (also note it doesn't even show the value of char values)
How to see actual value of a C++ string in CLion's debugger?
With gdb you can print std::string by below 2 methods.
- p mystr.c_str() -this can be used to print value of type std::string.
- p *(char**) 0x7f8fbb7a9c20 -this works for a memory with type std::string.
It’s 2020, and this is how we have to print std::string Values in a debugger:
p *(char**) 0x7f8fbb7a9c20... –
Cu It seems like a bug of LLDB. You can check this issue: https://youtrack.jetbrains.com/issue/CPP-13701
I have tried GDB, and it works well, so you can switch to GDB toolchains to avoid this problem.
However, in 2021, if you have to use LLDB, you can use the memory address of the variable std::string mystr;
- In LLDB console:
p *(char**) &mystr - Or, add this expression
*(char**) &mystrinto the watcher window of CLion-2021 debugger
Just add a watch for a desired std::string expression and edit the watch to append .c_str() (F2 will work fine for that).
E.g. for examining the my_cpp_str variable, add the following watch:
my_cpp_str.c_str()
© 2022 - 2024 — McMap. All rights reserved.


add_definitions(-D_GLIBCXX_USE_CXX11_ABI=0))? Does it help? – Jodiejodo