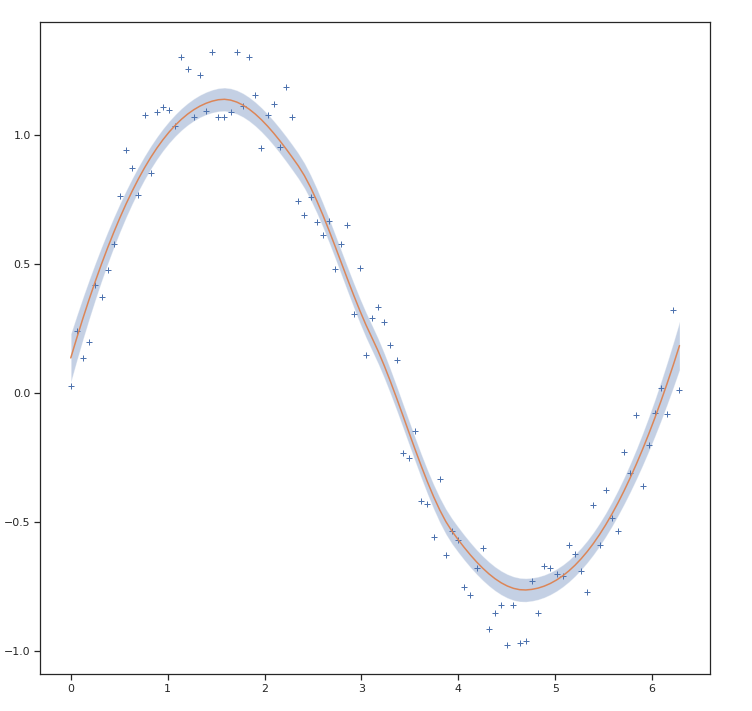
How would I calculate the confidence intervals for a LOWESS regression in Python? I would like to add these as a shaded region to the LOESS plot created with the following code (other packages than statsmodels are fine as well).
import numpy as np
import pylab as plt
import statsmodels.api as sm

x = np.linspace(0,2*np.pi,100)
y = np.sin(x) + np.random.random(100) * 0.2
lowess = sm.nonparametric.lowess(y, x, frac=0.1)

plt.plot(x, y, '+')
plt.plot(lowess[:, 0], lowess[:, 1])
plt.show()
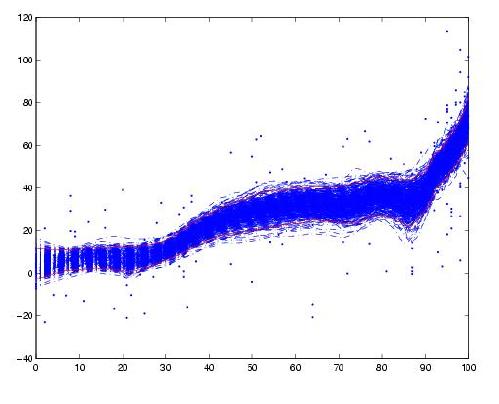
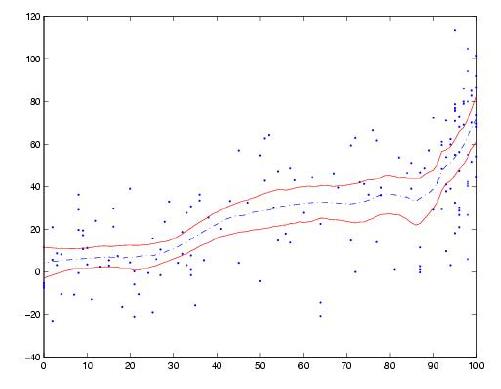
I've added an example plot with confidence interval below from the webblog Serious Stats (it is created using ggplot in R).


