Graphing slow counters with prometheus and grafana
Asked Answered
F

2

20

We graph fast counters with sum(rate(my_counter_total[1m])) or with sum(irate(my_counter_total[20s])). Where the second one is preferrable if you can always expect changes within the last couple of seconds.

But how do you graph slow counters where you only have some increments every couple of minutes or even hours? Having values like 0.0013232/s is not very human friendly.

Let's say I want to graph how many users sign up to our service (we expect a couple of signups per hour). What's a reasonable query?

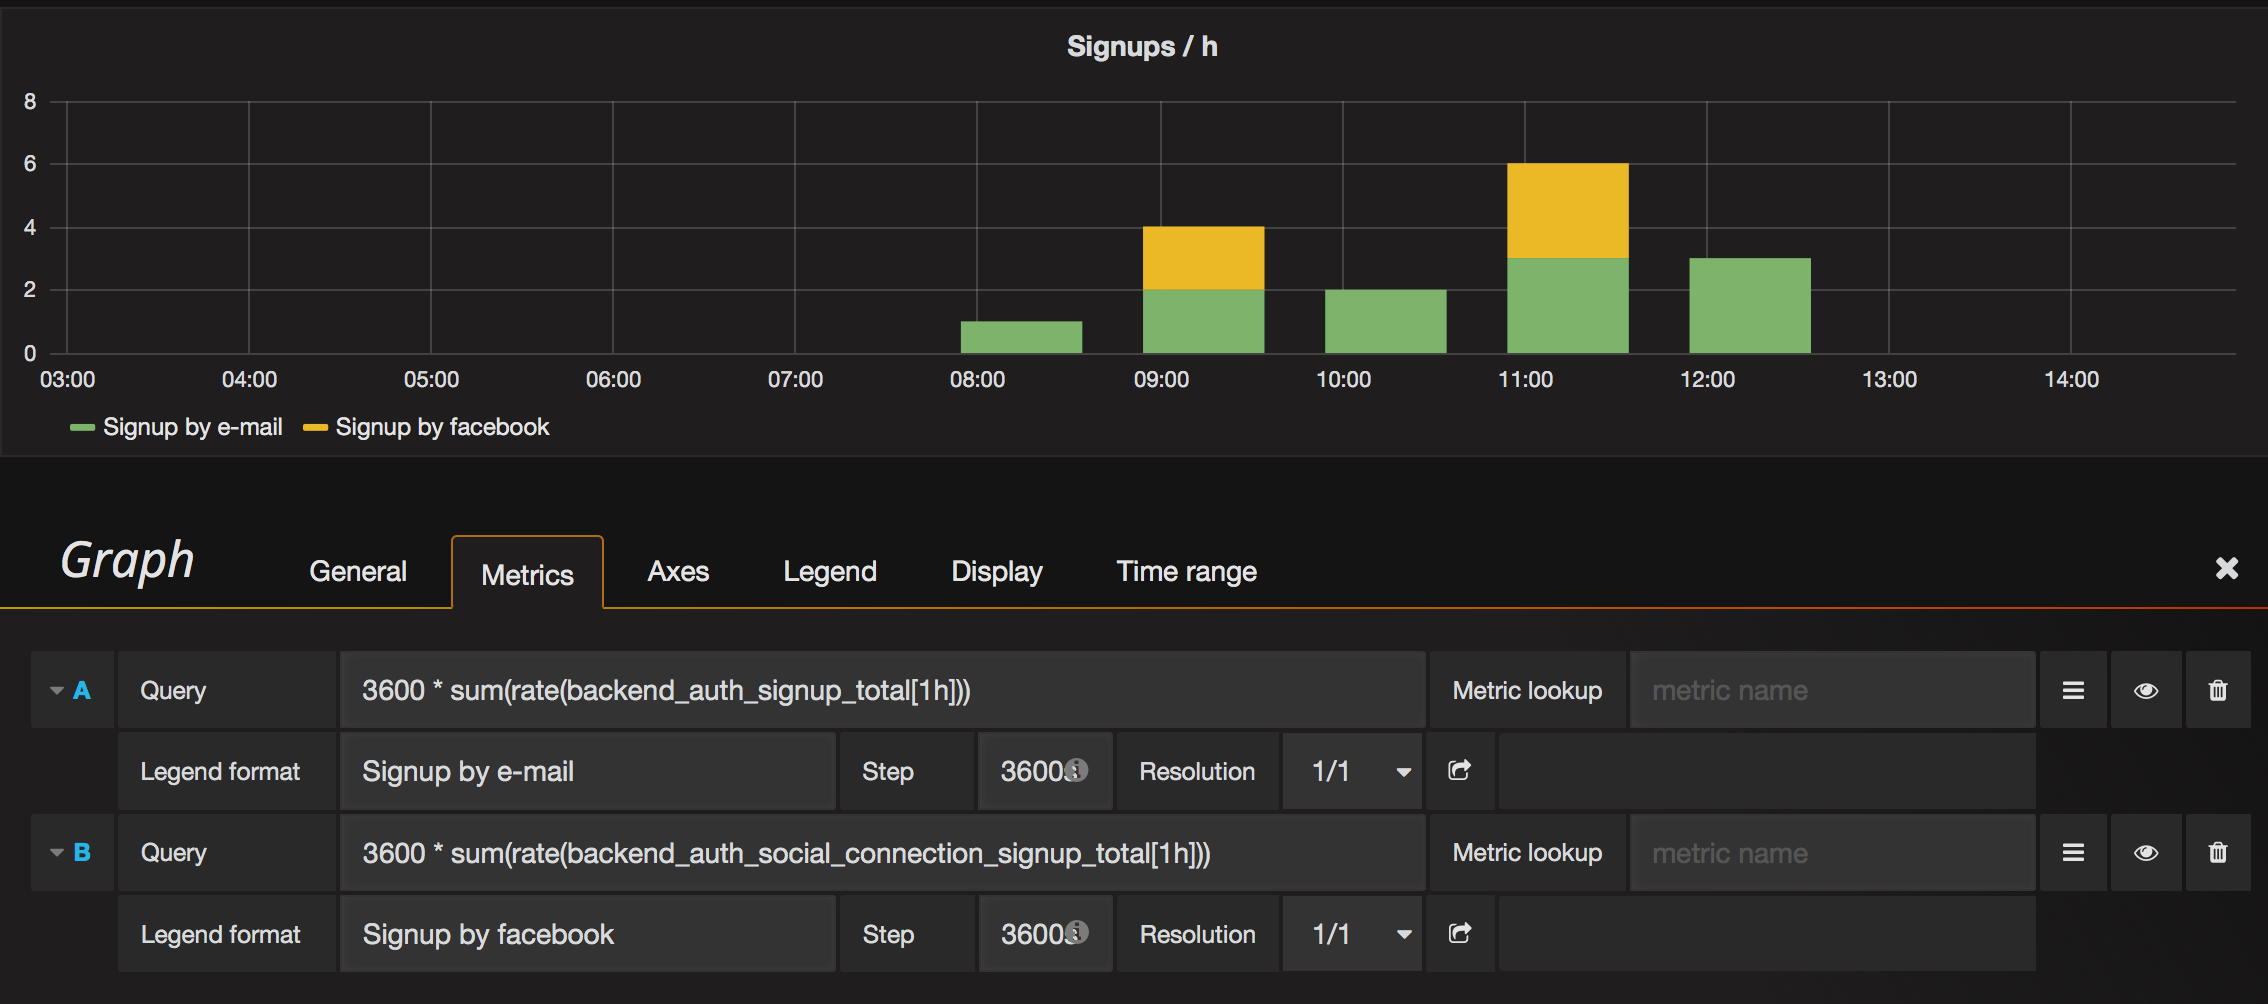
We currently use the following to graph that in grafana:

  • Query: 3600 * sum(rate(signup_total[1h]))
  • Step: 3600s
  • Resolution: 1/1

Slow counter setup

Is this reasonable?

I'm still trying to understand how all those parameters play together to draw a graph. Can someone explain how the range selector ([10m]), the rate() and the irate() functions, the Step and Resolution settings in grafana influence each other?

Frankiefrankincense answered 29/7, 2016 at 13:10 Comment(2)
I thought 3600 * sum(rate(signup_total[1h])) is the same as sum(increase(signup_total[1h]))Edholm
The increase() function in Prometheus can return unexpected fractional results for slowly changing integer counters such as the number of signups or the number of pageviews. This is due to extrapolation for rate() and increase(). If you need the correct results, then try increase() function from MetricsQL.Bracy
R
9

That's a correct way to do it. You can also use increase() which is syntactic sugar for using rate() that way.

Can someone explain how the range selector

This is only used by Prometheus, and indicates what data to work over.

the Step and Resolution settings in grafana influence each other?

This is used on the Grafana side, it affects how many time slices it'll request from Prometheus.

These settings do not directly influence each other. However the resolution should work out to be smaller than the range, or you'll be undersampling and miss information.

Ramses answered 29/7, 2016 at 13:31 Comment(3)
I'm still having a hard time putting everything together. For a counter with some increments per minute I would use sum(increase(my_counter_total[1m])) to show the rate/m. This works best when setting the step in grafana to 1m and the resolution to 1/1. So every value plotted corresponds to the number of occurences per min.. But when you choose a large time frame (30d), the graph takes ages to load because it requests many 1m steps. Setting the step to automatic (leaving it empty) works for small timeframes where the value < 1m. If the step gets e.g. 10m the values make no sense anymore.Frankiefrankincense
Yes, that happens. I'd suggest sticking with rate() so that everything is consistently per-second. github.com/grafana/grafana/pull/4257 should improve this.Ramses
The PR you mentioned seems to be exactly the solution for this! For now we'll go for the per second rate I guess...Frankiefrankincense
B
0

The 3600 * sum(rate(signup_total[1h])) can be substituted with sum(increase(signup_total[1h])) . The increase(counter[d]) function returns counter increase on the given lookbehind window d. E.g. increase(signup_total[1h]) returns the number of signups during the last hour.

Note that the returned value from increase(signup_total[1h]) may be fractional even if signup_total contains only integer values. This is because of extrapolation - see this issue for technical details. There are the following solutions for this issue:

  • To use offset modifier: signup_total - (signup_total offset 1h) . This query returns correct results if signup_total wasn't reset to zero during the last hour. In this case the sum(signup_total - (signup_total offset 1h)) is roughly equivalent to sum(increase(signup_total[1h])), but returns more accurate integer results.
  • To use VictoriaMetrics. It returns the expected integer results from increase() out of the box. See this article and this comment for technical details.
Bracy answered 30/3, 2022 at 10:2 Comment(0)

© 2022 - 2024 — McMap. All rights reserved.