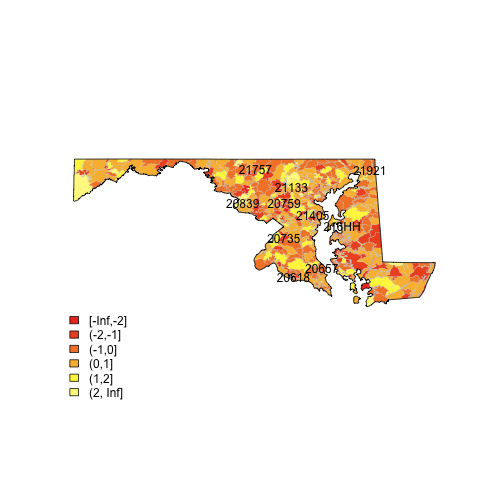
I am assuming you want static maps.
![alt text]()
(source: eduardoleoni.com)
1) Get the shapefiles of the zip boundaries and state boundaries at census.gov:
2) Use the plot.heat function I posted in this SO question.
For example (assumes you have the maryland shapefiles in the map subdirectory):
library(maptools)
##substitute your shapefiles here
state.map <- readShapeSpatial("maps/st24_d00.shp")
zip.map <- readShapeSpatial("maps/zt24_d00.shp")
## this is the variable we will be plotting
zip.map@data$noise <- rnorm(nrow(zip.map@data))
## put the lab point x y locations of the zip codes in the data frame for easy retrieval
labelpos <- data.frame(do.call(rbind, lapply(zip.map@polygons, function(x) x@labpt)))
names(labelpos) <- c("x","y")
zip.map@data <- data.frame(zip.map@data, labelpos)
## plot it
png(file="map.png")
## plot colors
plot.heat(zip.map,state.map,z="noise",breaks=c(-Inf,-2,-1,0,1,2,Inf))
## plot text
with(zip.map@data[sample(1:nrow(zip.map@data), 10),] , text(x,y,NAME))
dev.off()


