IE11 XMLHttpRequest really slow performance
Asked Answered
H

8

34

I have an angular material SPA web site that performs very well in Chrome, Firefox and Edge, but it lags massively in IE11.

I am aware of angular material issues with animations and styles in IE11 and have made several changes to improve general performance in that area (disable animations, even removing theming, etc...).

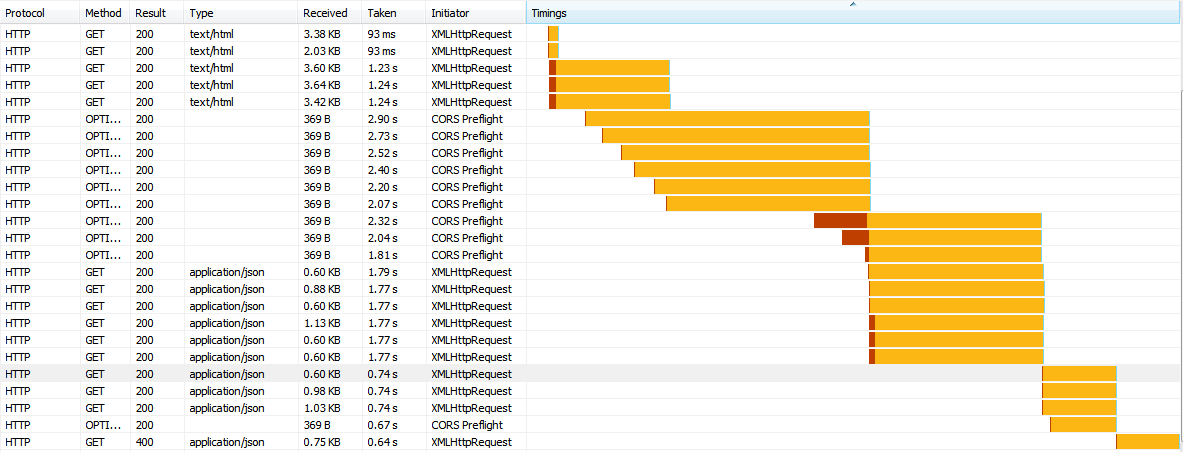
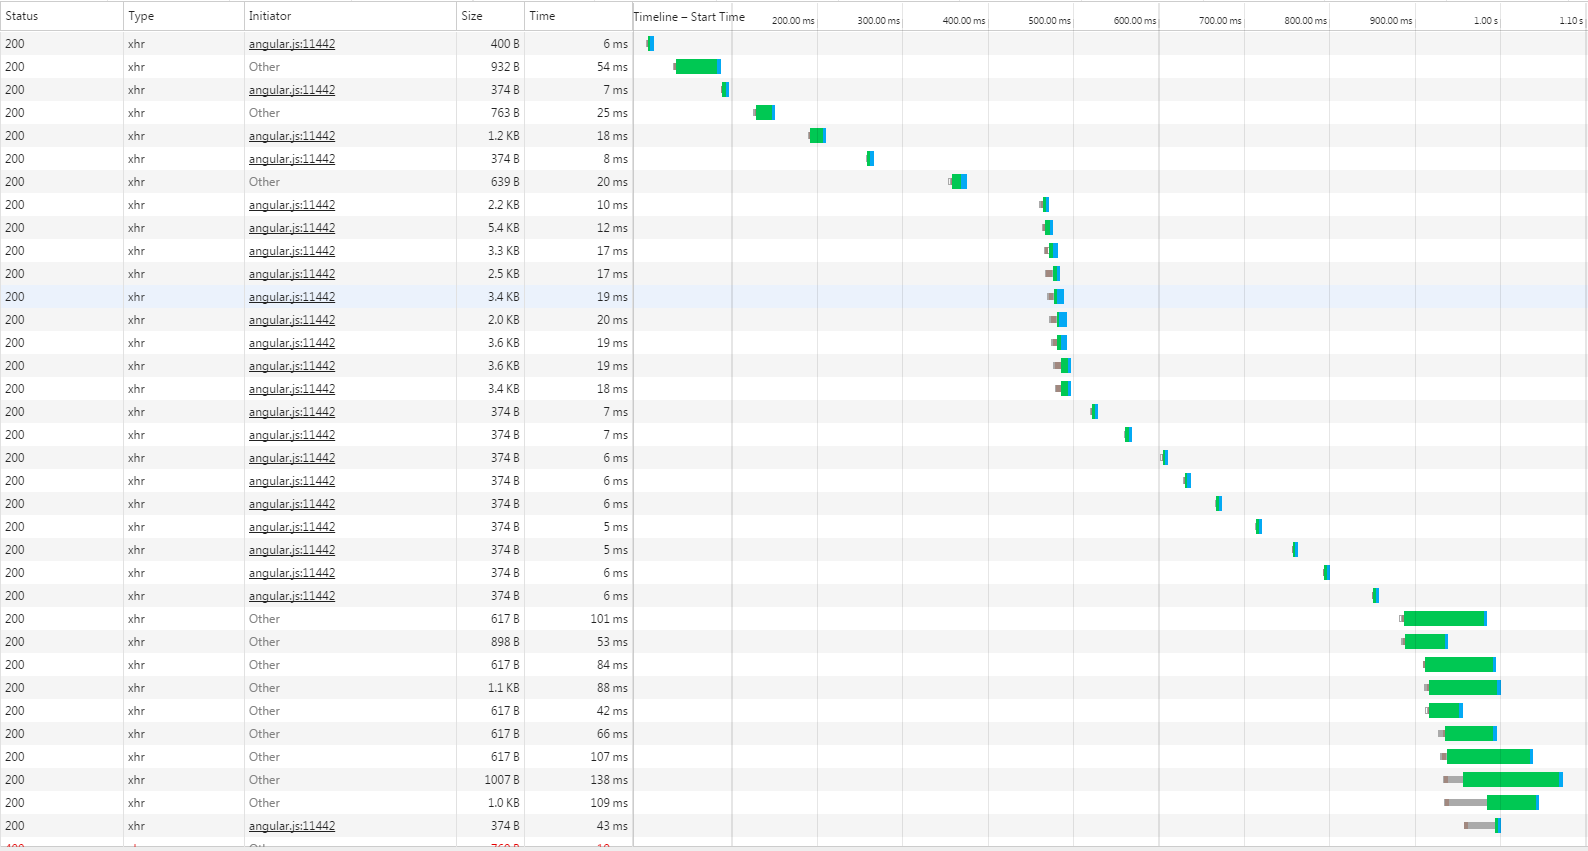
But, even if that improves the application slightly, I can still see a massive lag when loading resources, where every request spends a long (really long time) to be processed. I have checked the server and the response is always in the milliseconds range (as it is in Chrome), but it takes forever in IE11.

Please check the load network times for IE11.

enter image description here

vs Chrome.

enter image description here

Any ideas of what might be causing this?

Cheers,

Hancock answered 18/10, 2016 at 14:36 Comment(8)
@Mistalis The browser wars of IE and Netscape is why we have a lot of things, it is not the worst.... If you were not around for document.all and document.layers you missed out on the real fun.Hanforrd
What does yellow stand for in your IE dev tools? If it's TTFB, does your server do anything differently for the requests that come from IE?Reaves
No, it does exactly the same, but I think I have narrowed the issue to style calculation holding the thread of the network (which actually makes sense), but network tab is quite confusing.Hancock
@Hancock I'm facing a similar problem. Can you say a bit more about what you've discovered? Did you manage to find a satisfactory solution?Dobson
@Dobson If you are using angular-material check github.com/angular/material/issues/8329, in the end for me was mostly styles, I removed lots of unnecesary CSS files and it eventually became responsive enough (not fast, but workable)Hancock
@Hancock No I'm using jQuery. But it was enough of a hint to decouple the DOM manipulation from the ajax:success function (using setTimeout). I then tried to decrease the access to the DOM when building the result. Seems to have improved things.Dobson
@Hancock Those Network tab screenshots don't seem equivalent to be really comparative. I suggest you isolate a single XHR call and do your testing with it while gradually adding parallel asynchronous requests in progression after all the other assets have loaded since you are suspecting only XHR.Stephine
What's your backend, are you using some sort of IIS backend? IE may be trying to do some additional browser-specific backend stuff that only a windows backend can do.Outfit
D
1

I would attach a REAL OS debugger to the browser and try and determine if IE is actually spinning off a thread to execute the XHR. This is a difficult investigation but it would explain a lot.

Most browsers do and then marshal callbacks and data back to the MAIN UI THREAD. But IE is OLD and I do not know what it does.

On another thought. Our LARGE company that moves slow finally dropped IE support allowing us to write decent code with promises without a polyfill. Our codebase is slowly cleaning up other weird polyfills that we acquired over time. For the longest time we could NOT write for (var key in thing) because a polylfill would show up in the list.

You might consider that discussion with customers. It starts with "How about Edge or Firefox" You can talk about other things getting replaced. You refresh your Phone and laptop...how about the browser...

Above all good luck.

Debris answered 27/8, 2020 at 11:50 Comment(2)
+1. I would add that old, unsupported browsers like IE11 are not getting updates to make use of new security features implemented on the server (for example the content-security-protocol header). By continuing to support IE11, we are enabling our customers to operate in an unsecure manner on the internet and the odds of them suffering financial loss (and possibly our companies as well) are high.Mockup
It is a hard problem to solve. For me when people are stubborn until someone else mentions something new. We had a big customer finally go into FireFox and were able to drop support. But the browser platforms still have their problems at times.Debris
C
0

You might investigate that XMLHttpRequest gets intercepted. While modern browsers performance penalty on this is smaller, for IE exchanging native calls with JS functions impacts to a certain degree and scales with its usage. This applies to a variety of polyfills and extended functionality.

Condensable answered 22/7, 2020 at 9:50 Comment(0)
S
0

Based on your screen shots, it looks like there may be a bottleneck around the "CORS Preflight " Requests.... Perhaps this https://developer.akamai.com/blog/2015/08/17/performance-single-page-apps would explain a viable work around for you.

Furthermore, I would look into why your application is making a slew of OPTION requests, unless that is intended, you application is making many round trips, each delaying the next, and with a limit on concurrent connections you end up consuming the pool and blocking further requests...

It would be interesting to see what is happening over the network, via IE's network tab...

Separates answered 26/7, 2020 at 20:25 Comment(0)
D
0

This looks like XMLHttpRequest is queuing up and then being executed in a batch, essentially stalling every request until some internal process sends them all at once.

The first place I'd investigate is that IE has (poorly documented) internal limits on how many concurrent XMLHttpRequest and browser requests it will allow at once. In older versions this was 2, but it increased around IE8 to up to 6 depending on some awful and unreliable internal metric as to how fast IE thought your network is. IE11 still does this, but has a higher limit.

My guess would be that you have hit this limit, and once you have hit it the internal timer check that manages the batches in IE is taking 1-2s before it sends another set to the server.

To test this hypothesis: in IE11 only add a 100ms wait (it just needs to be enough to throttle the number of parallel requests) before sending every request. It will still be awful slow, but if internal batching is the cause you won't see the 1-2s delay in blocks on the requests.

If that is the problem the fix may be some kind of batching yourself to try and avoid hitting IE's cap, but as that is dynamic I suspect it will be a disproportionate amount of pain for <1.5% of users.

Deliberate answered 30/7, 2020 at 15:3 Comment(0)
F
0

5-6 ms in Chrome seems to be too short a time to make an actual server call. If we are looking at the same network calls in both screenshots (it is not clear that that is the case), then it is more likely that Chrome is using a Cached response, and IE is making a network call. Please review your caching headers and make sure you are using ones that IE understands.

Final answered 14/10, 2020 at 23:29 Comment(0)
A
0

This issue originates in the Internet Explorer browser's configuration for AJAX requests.

Perform the following local-change:

Make local policy changes as below:

Navigate to Windows Components > Internet Explorer > Security Features > AJAX Enable 'Allow native XMLHTTP Support'. Change the 'Maximum number of connections per host (HTTP1.1)' to 16. Change the 'Maximum number of connection per server (HTTP1.0)' to 16.

Apart from this, most of the companies are dropping support for IE. Nobody wants to write polyfills for a thing no one uses and why are you using IE? please reply I want to know.

Atavism answered 3/12, 2020 at 2:22 Comment(0)
I
0

You can dig deeper to trace http network using Microsoft ETL logs

  •  Create a folder C:\msfiles

  •  open an Admin elevated cmd

  •  issue the command netsh trace start InternetClient_dbg capture = yes maxsize = 450 filemode = circular persistent = yes overwrite = yes traceFile = C:\msfiles\Etl_trace.etl

  •  do the action that you want that is the actual network problem

  •  stop the trace using command netsh trace stop

-> you have now the Etl_trace.etl

Do it once with IE and once with Chrome and compare the logs...

Imprison answered 3/12, 2020 at 18:29 Comment(0)
H
-1

I had similar issue with AngularJS in IE we tracked our issue to a security update for IE (KB2962872). Uninstalling that patch brought performance back up to normal.

Hornwort answered 28/8, 2018 at 15:14 Comment(1)
Can you go into some details? Because typically websites don't have the luxury to uninstall security updates on other people's computers. (i.e. what in that update do you think is responsible, and how did you confirm it was that update beyond merely uninstalling it and going "things are faster now", which doesn't help understand the underlying problem)Santiago

© 2022 - 2024 — McMap. All rights reserved.