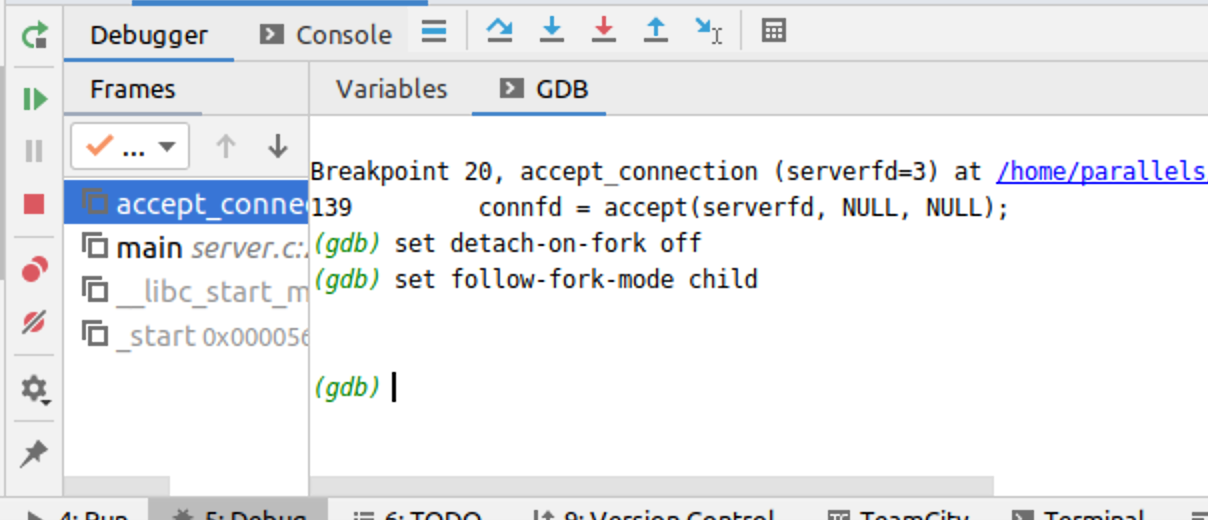
I was debugging a Linux C program with CLion's internal debugger (which is gdb on Linux). The program forked a child process that was supposed to get suspended at the break point I set. But the debugger didn't stop there even if I had entered set follow-fork-mode child inside the gdb panel. So how can I make that happen with CLion?
I followed answer posted by @MarkusParker, but instead of set auto-load safe-path / I used set detach-on-fork off to prevent disconnect from child process. This instruction works for me:
Set a break point at the beginning of your program (ie. the parent program, not the child program).
Start the program in the debugger.
Go to the debugger console (tab with the label gdb) in clion and enter
set follow-fork-mode childandset detach-on-fork off.Continue debugging.
~/.gdbinit and add these commands inside (each in a separate line). This will probably only take effect if you are using your system's gdb. –
Footmark according to this link debugger: Support multi-process targets
It's still not supported in Clion. set detach-on-fork off will add a thread to the frame, but you still can't control the child process. And Clion
"treats exit of one of the inferiors as end of debugging session even-though others are still running".
I think there is a same issue with vscode.
Ensure that you set set follow-fork-mode child before the fork.
set detach-on-fork off. –
Influx © 2022 - 2024 — McMap. All rights reserved.

