Cannot evaluate expression because a thread is stopped at a point where garbage collection is impossible
Asked Answered
F

12

34

Here is the error

Cannot evaluate expression because a thread is stopped at a point where garbage collection is impossible, possibly because the code is optimized.

I am writing a simple console app and the first line of code is this:

List<MyObjectModel> list = MyObjectModel.GetNonCompletedReturns();

and the code for the function is:

public static List<MyObjectModel> GetNonCompletedReturns()
{
    MyObject service = new MyObject();
    List<MyObject> entities = 
                      (from recs in service.Retrieve() where select recs).ToList();

    List<MyObjectModel> models = new List<MyObjectModel>();

    foreach (MyObject entity in entities)
    {
        models.Add(BindModel(entity));
    }

    return models;
}

and if I try to step through the code, as soon as I get back to the main of my app and hover over the list, I get the error message that I showed.

Can anyone help?

Feltonfelts answered 14/6, 2011 at 18:23 Comment(2)
Why is this tagged as asp.net?Scheld
Possible duplicate of What does "Cannot evaluate expression because the code of the current method is optimized." mean?Dessiatine
H
15

This error fires only when you are trying to use Watch dialog during debug. Try to use some other technique to output the variables, like Debug.WriteLine, Console.WriteLine and so on.

Housewifely answered 14/6, 2011 at 18:30 Comment(8)
This seems like an egregious design flaw - not being able to watch a variable during debug?Flavor
I think that this behavior was chabged across time since the original question. I've never met it in VS 2015Housewifely
I did encounter it in VS2015 (which is how I came to this question)Flavor
Your watch operation can be a time-consuming, and Watch dialog has a timeout for evaluation.Housewifely
Is there anything we can do about watch dialog timeout? A setting we can change so it doesn't timeout?Backstay
@TabAlleman I really don't know. If you need something to know, why don't you simply trace it in Output window, for example?Housewifely
Yes, I did end up doing something like that, but the quick watch would be preferable because you can use it like an explorer to look at multiple properties and drill into sets etc.Backstay
I'm getting this in VS 2017 .net Core 2.1 MVC. Ensure you're in DEBUG not RELEASE modeAudi
S
28

If your project is compiled in release (with optimizations turned on), you may see this. Have you tried the DEBUG configuration?

Scheld answered 14/6, 2011 at 18:34 Comment(3)
My project is compiled in debug with no optimalization.Marley
Thanks! I had turned on "Code Optimization" in my build process. Makes sense that it would mess up the debug symbols.Tobe
Yes this is the solution for me, i was trying to debug while running in release mode.Fantasy
H
15

This error fires only when you are trying to use Watch dialog during debug. Try to use some other technique to output the variables, like Debug.WriteLine, Console.WriteLine and so on.

Housewifely answered 14/6, 2011 at 18:30 Comment(8)
This seems like an egregious design flaw - not being able to watch a variable during debug?Flavor
I think that this behavior was chabged across time since the original question. I've never met it in VS 2015Housewifely
I did encounter it in VS2015 (which is how I came to this question)Flavor
Your watch operation can be a time-consuming, and Watch dialog has a timeout for evaluation.Housewifely
Is there anything we can do about watch dialog timeout? A setting we can change so it doesn't timeout?Backstay
@TabAlleman I really don't know. If you need something to know, why don't you simply trace it in Output window, for example?Housewifely
Yes, I did end up doing something like that, but the quick watch would be preferable because you can use it like an explorer to look at multiple properties and drill into sets etc.Backstay
I'm getting this in VS 2017 .net Core 2.1 MVC. Ensure you're in DEBUG not RELEASE modeAudi
O
2

None of the answers solved my problem so I'm posting the solution that helped me.

"If there is to much data in the parameters then this error can occure, a simple solution is to make an object, not a struct because that's a dataobject.

Put this object in your parameters instead of all the different variables, normally the problem will no longer take place."

Otoscope answered 21/11, 2013 at 11:28 Comment(0)
P
1

Here's a little trick just in case you want to examine some objects and you are not able to change the parameters:

I've created a call to a new temporary function, inside the function from where I was unable to watch my object. Then, inside that new function I was able to watch my object. After the job is done, just delete the function.

Paragon answered 15/5, 2015 at 7:35 Comment(0)
L
1

While it's true that the "Cannot evaluate expression because a thread is stopped at a point where garbage collection is impossible, possibly because the code is optimized" error appears when in release mode, most developers just ensure that their projects are configured to compile as a debug build. BUT to be sure that you have no release-DLL issues, you also must check the references to DLLs that are in your solution and make sure that you don't have a reference to a release-build DLL. If you find that this is the case, delete the DLL reference and then add a project reference rather than a DLL reference. The project reference will ensure that your solution references debug or release versions of the DLL as specified in your build configuration.

Note that the above advice applies, of course, to only those DLLs to which you have source code and which are built from a project in your solution.

Lockage answered 7/7, 2017 at 4:50 Comment(0)
L
1

Try to disable "Enable .NET Framework source stepping" in Options -> Debugging -> General. It helped me with this issue.

Luxuriant answered 20/9, 2023 at 13:24 Comment(0)
I
0

I got this too, when I hit a NullReferenceException from a 3rd party control.

In this one case, I found that if I set a breakpoint before I hit the exception, I could then single step through the rest of the code without seeing the problem.

No idea why, but this worked for me - in this case at least.

Inhalant answered 18/9, 2012 at 19:50 Comment(1)
Be careful when posting copy and paste boilerplate/verbatim answers to multiple questions, these tend to be flagged as "spammy" by the community. If you're doing this then it usually means the questions are duplicates so flag them as such instead: https://mcmap.net/q/451773/-asp-net-cannot-evaluate-expression-because-a-thread-is-stopped-at-a-point-where-garbage-collection-is-impossibleSuborder
C
0

For what it's worth, this error can also be caused by an infinite loop in a property getter (simplified version below). When the debugger attempts to evaluate the property (e.g. in the watch window) the UI will hang for a few seconds and the "Cannot evaluate expression..." error will appear for many of the other properties in the same class.

public int MyProperty
{
    get
    {
        while (true) { }
        return 0;
    }
}
Capeskin answered 14/9, 2014 at 21:56 Comment(0)
D
0

First make sure that you're running your code in DEBUG mode and with code optimization turned off. you can turn that off from the properties of your project.

If you made all of the above and the problem persists, then it's probably a problem with the stack having Debug.Break() on top of it. The solution for this is very easy, just press F10 to move to the next line and you should be able to evaluate the expression.

You can check this SO question for more information about this issue.

Dessiatine answered 18/10, 2017 at 9:28 Comment(0)
R
0

I was experiencing the same error message in the Visual Studio debugger when evaluating a linq expression.

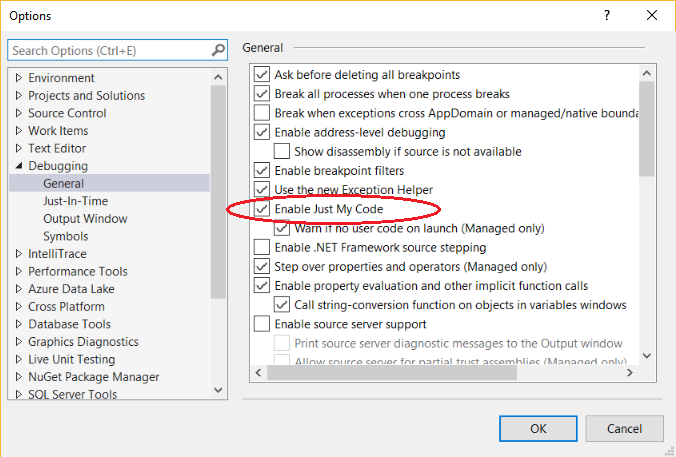
Disabling the VS debugger config setting 'Enable Just My Code' resolved the issue for me:

To enable or disable Just My Code, choose the Tools > Options menu in Visual Studio. In the Debugging > General node, choose or clear Enable Just My Code.

visual studio enable just my code

https://learn.microsoft.com/en-us/visualstudio/debugger/just-my-code

Ratline answered 20/2, 2018 at 19:44 Comment(0)
S
0

I was having same issue in Visual Studio 2017. Going to Debug> Options> Debugging> General and checking "Suppress JIT optimization on module load(Managed only)" fixed my issue

Sheatfish answered 26/11, 2019 at 15:5 Comment(0)
E
-1

view image for solution

check this one in Debug > options > Debugging > General . this solved my issue

Eldoraeldorado answered 16/5, 2023 at 3:53 Comment(1)
It is not clear from just an image which of the options are essential to solve the issue.Squeamish

© 2022 - 2024 — McMap. All rights reserved.