In more recent versions of matplotlib (e.g. 3.7.0), there's no need to explicitly convert date to numbers, matplotlib handles it internally. So simply passing the datetime objects as x-values works.
To show custom ticks, DateFormatter along with MinuteLocator/MicrosecondLocator etc. (depending on the resolution of the time component) can be used.
import matplotlib.pyplot as plt
import matplotlib.dates as mdates
import datetime

data = [[1293606162197, 0, 0], [1293605477994, 63, 0], [1293605478057, 0, 0],
        [1293605478072, 2735, 1249], [1293606162213, 0, 0], [1293606162229, 0, 0]]

# sort time-series by datetime
x, y1, y2 = zip(*sorted(data, key=lambda x: x[0]))

# convert to datetime objects
x = [datetime.datetime.fromtimestamp(i / 1000) for i in x]

fig, ax = plt.subplots()
ax.plot(x, y1, label='y1');       # plot y1 series
ax.plot(x, y2, label='y2')        # plot y2 series
ax.xaxis.set_major_formatter(mdates.DateFormatter('%d/%m %H:%M'))  # format date/time
ax.xaxis.set_major_locator(mdates.MinuteLocator(interval=2))       # show every second minute
ax.legend()                                                        # show legend
fig.autofmt_xdate();                                               # format ticklabels
![img]()
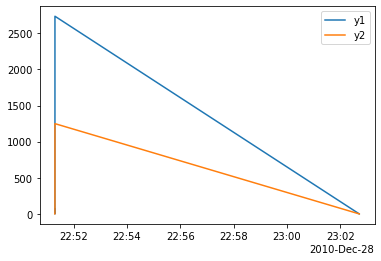
If you don't particularly care how datetime is shown as x-ticks, there matplotlib.dates.ConciseDateFormatter that does "pretty" formatting for you. For the example at hand, that would look like:
ax = plt.subplot()
ax.plot(x, y1, label='y1');       # plot y1 series
ax.plot(x, y2, label='y2')        # plot y2 series

locator = mdates.MinuteLocator(interval=2)
ax.xaxis.set_major_formatter(mdates.ConciseDateFormatter(locator))  # format date/time
ax.xaxis.set_major_locator(locator)                                 # show every second minute
ax.legend();
![img2]()


