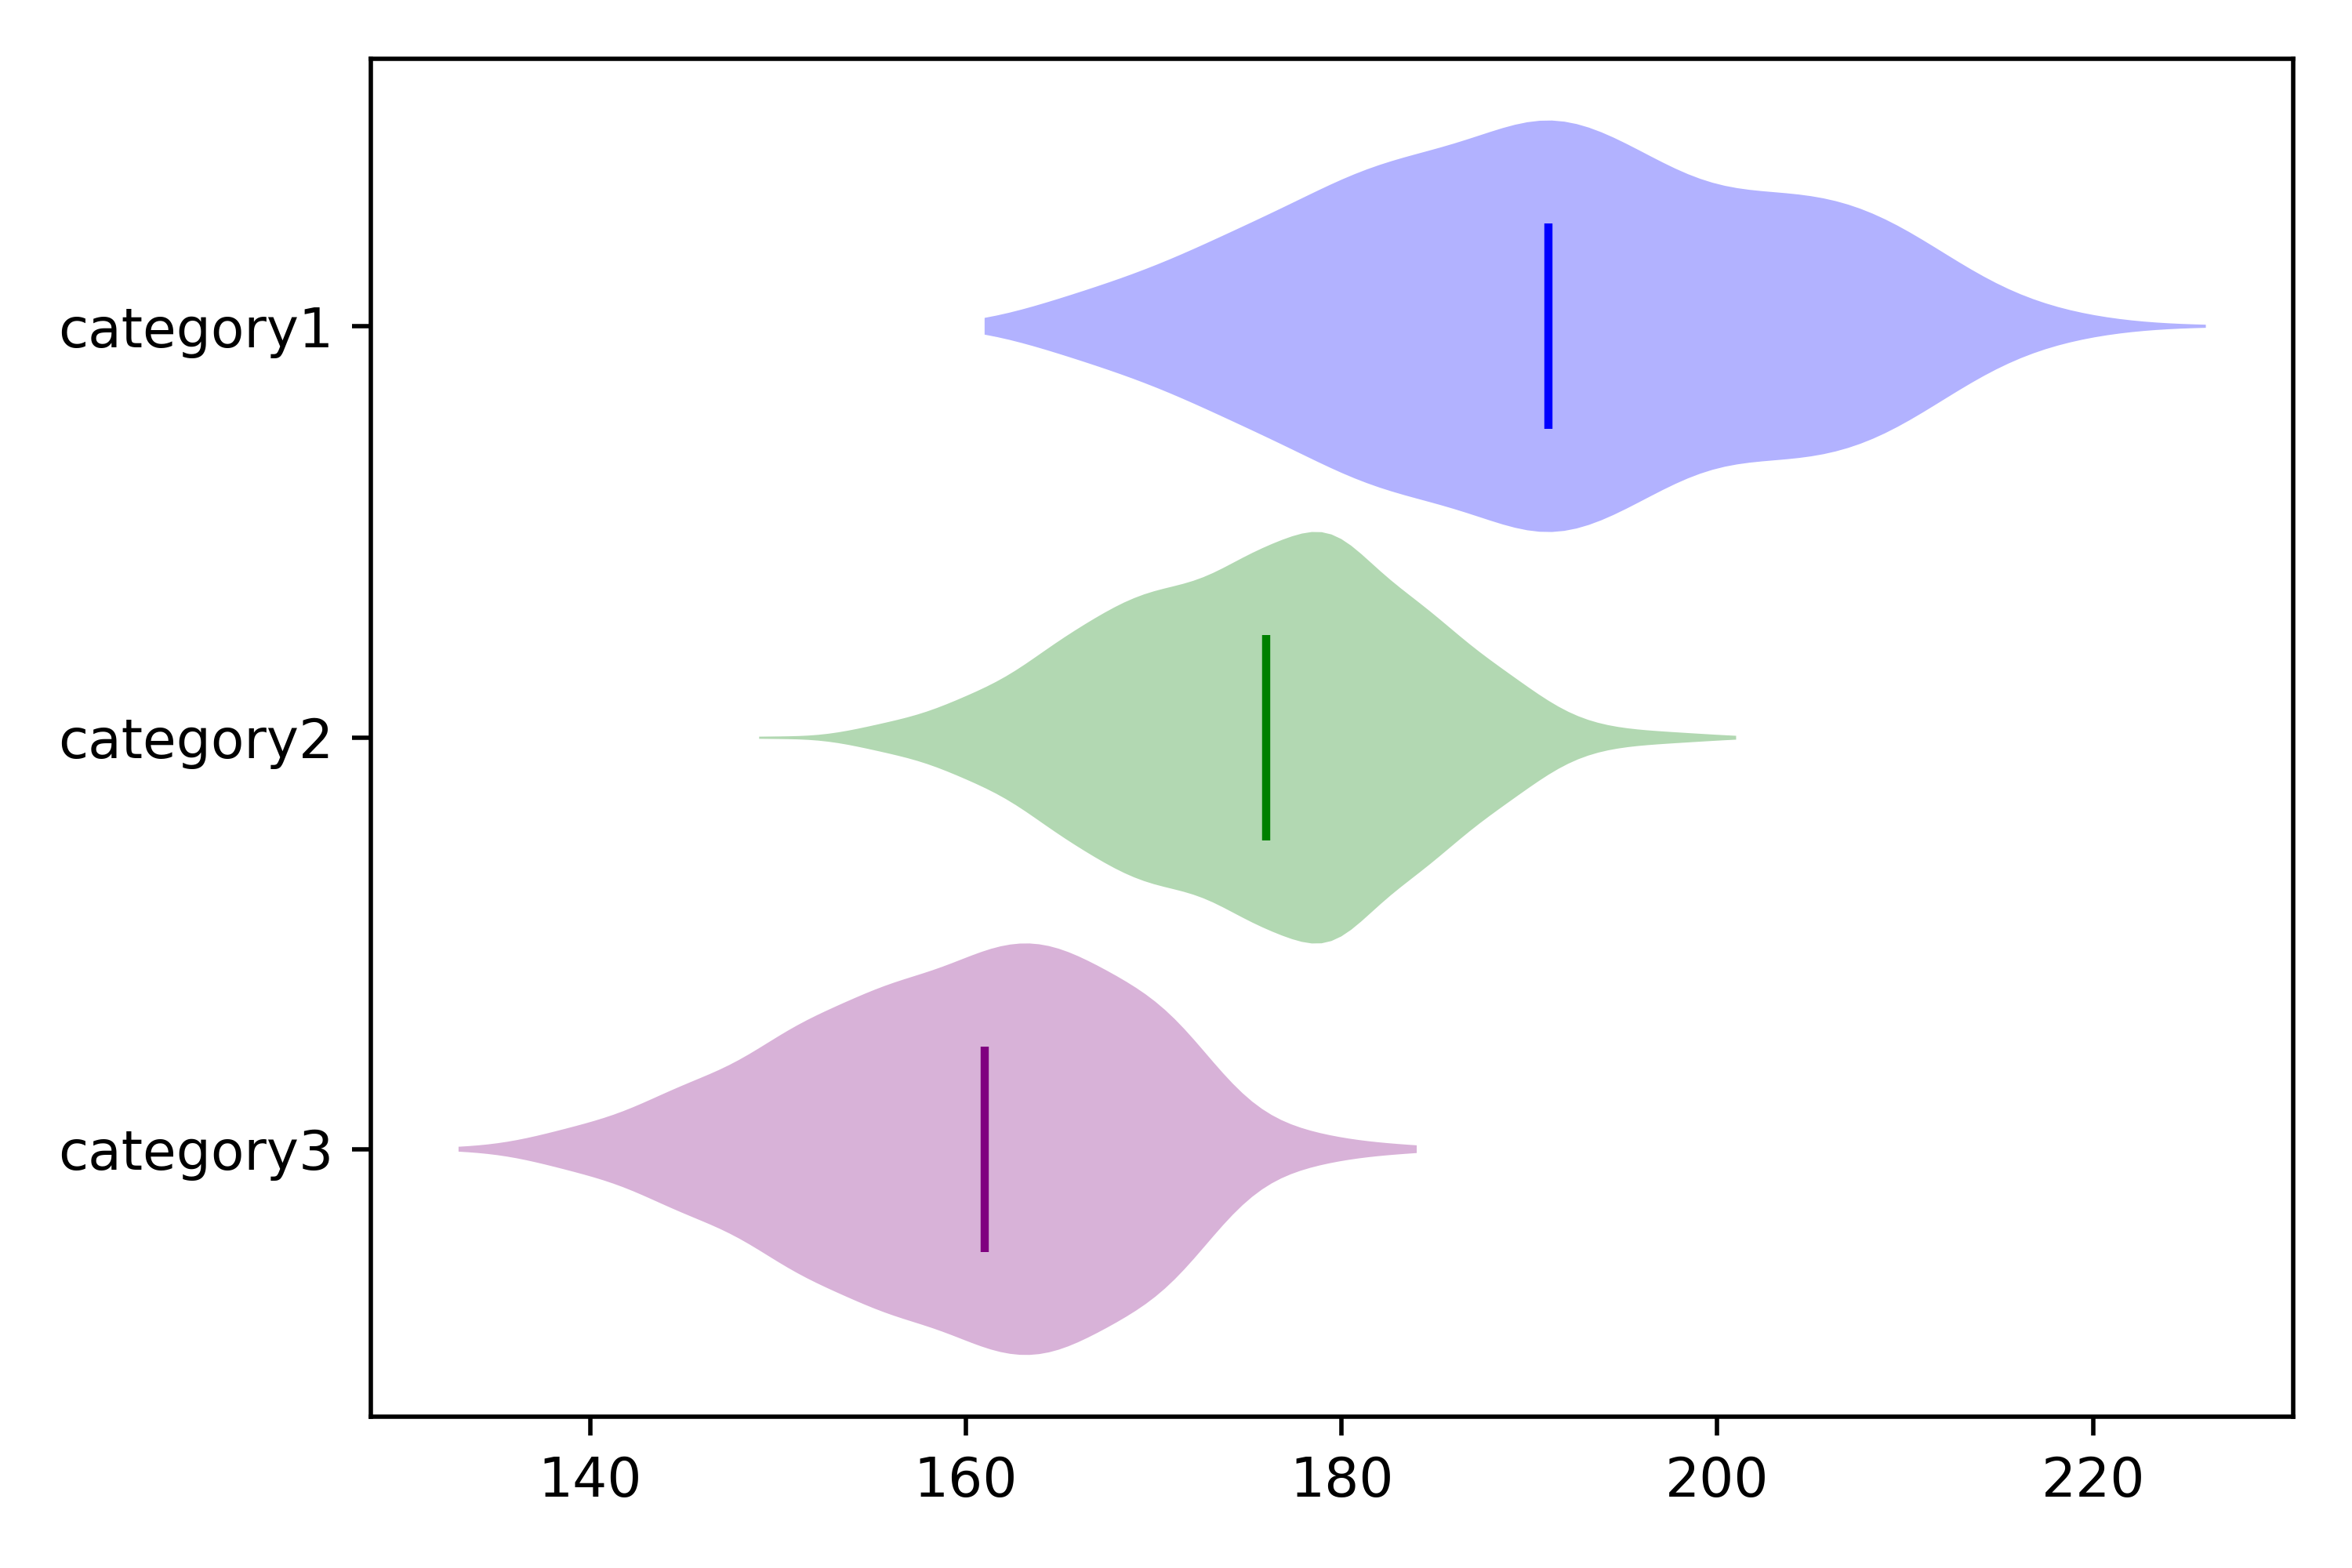
Suppose you have 3 vectors: data1, data2, data3; and you have plotted your matplotlib violinplots in one figure; then, to set the color of the median line and body facecolor specific for each sub-violinplot you can use:
colors = ['Blue', 'Green', 'Purple']

# Set the color of the violin patches
for pc, color in zip(plots['bodies'], colors):
    pc.set_facecolor(color)

# Set the color of the median lines
plots['cmedians'].set_colors(colors)
The full example:
# Set up the figure and axis
fig, ax = plt.subplots(1, 1)

# Create a list of the data to be plotted
data = [data1, data2, data3]

# Set the colors for the violins based on the category
colors = ['Blue', 'Green', 'Purple']

# Create the violin plot
plots = ax.violinplot(data, vert=False, showmedians=True, showextrema=False, widths=1)

# Set the color of the violin patches
for pc, color in zip(plots['bodies'], colors):
    pc.set_facecolor(color)

# Set the color of the median lines
plots['cmedians'].set_colors(colors)

# Set the labels
ax1.set_yticks([1, 2, 3], labels=['category1', 'category2', 'category3'])

ax1.invert_yaxis() # ranking from top to bottom: invert yaxis

plt.show()
![Example for matplotlib violin plots with different colors]()


