How to produce different geom_vline in different facets in R?
Asked Answered
P

3

34

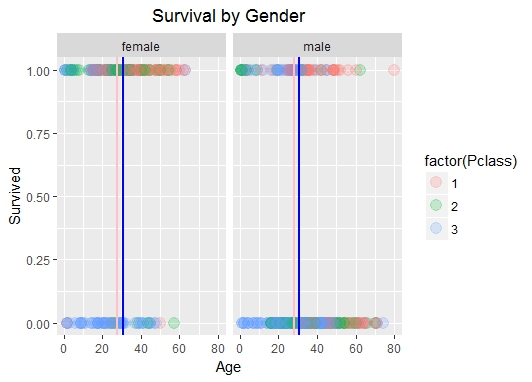
I am trying to produce 2 different geom_vlines with different colours in 2 different facets of a dataset. I am doing this to highlight means of 2 different facets.

Here's the dataset:

Pclass  Sex    Age  SibSp   Parch   Fare    Cabin   Embarked    Survived
  3     male    22   1        0     7.25                S          0    
  1     female  38   1        0    71.2833   C85        C          1
  3     female  26   0        0     7.925               S          1    
  1     female  35   1        0    53.1     C123        S          1
  3     male    35   0        0     8.05                S          0    
  1     male    54   0        0    51.8625   E46        S          0

Here's the code:

g<-ggplot(data = train3, aes(x = Age, y = Survived, colour = factor(Pclass)))
g<-g+facet_wrap(~Sex)
g<-g+geom_point(size = 4, alpha = 0.2)+ggtitle("Survival by Gender")+theme(plot.title = element_text(hjust = 0.5))
g<-g+geom_vline(data = subset(train3,Sex=="female"), xintercept = mean(train3[which(train3$Sex=="female"),3]), colour = "pink", size = 1)
g<-g+geom_vline(data = subset(train3,Sex=="male"), xintercept = mean(train3[which(train3$Sex=="male"),3]), colour = "blue", size = 1)
g

Here's the output

enter image description here

I actually want to produce only 1 vline in each facet: pink in female and blue in male.

The suggestion given here is not working either . Error shown being:

Error in .(Sex == "female") : could not find function "."
Ptarmigan answered 26/5, 2017 at 7:51 Comment(1)
reproducible example please.Munt
M
46

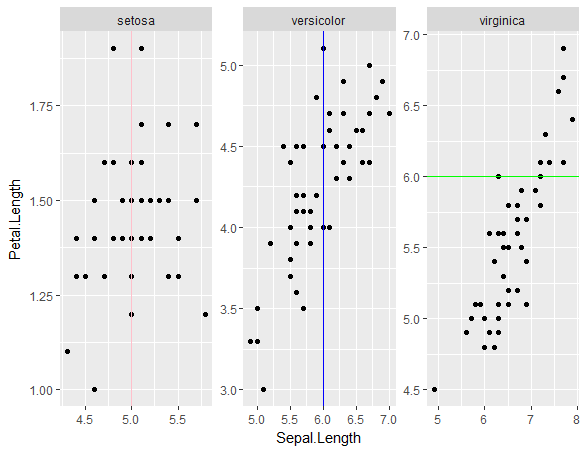
Here's how you can put in different geom_vline for different iris species:

ggplot(iris, aes(Sepal.Length, Petal.Length)) + facet_wrap(~Species, scales="free") + geom_point() + 
  geom_vline(data=filter(iris, Species=="setosa"), aes(xintercept=5), colour="pink") + 
  geom_vline(data=filter(iris, Species=="versicolor"), aes(xintercept=6), colour="blue") + 
  geom_hline(data=filter(iris, Species=="virginica"), aes(yintercept=6), colour="green") 

enter image description here

Munt answered 26/5, 2017 at 8:38 Comment(5)
Legend!! apparently that subset function in data call wasn't working. Glad to find that filter worked. Thanks for the quick help. Much appreciated.Ptarmigan
I thought the error was due to the xintercept not stated in aes?Munt
Compare geom_vline(data=subset(iris, Species=="setosa"), aes(xintercept=5), colour="pink") versus geom_vline(data=subset(iris, Species=="setosa"), xintercept=5, colour="pink")Munt
This works fine for 3 facets, but is there any way to do this efficiently for large numbers of facets?Marche
This looks like it would work for multiple facets more easily #10942860Calamite
S
24

You can create a data.frame with one column being intercept values to be used for lines and a second column with Sex. So that when using facet_wrap, they are separated.
Something like:

dataInt <- train3 %>%
  group_by(Sex) %>%
  summarize(Int = mean(Age))

Then you can use it in your script:

g<-ggplot(data = train3, aes(x = Age, y = Survived, colour = factor(Pclass))) + 
  facet_wrap(~Sex) +
  geom_vline(data=dataInt, aes(xintercept=Int))

Without your data, I cannot test this.

[EDIT: With a reprex] If I use the same data as Adam Quek for a reproducible example, the code would be automated as follows:

library(tidyverse)

dataLine <- iris %>%
  group_by(Species) %>%
  summarize(mean_x = mean(Sepal.Length))

ggplot(iris) +
  aes(x = Sepal.Length, y = Petal.Length) +
  facet_wrap(facets = vars(Species)) + 
  geom_point() + 
  geom_vline(data  = dataLine, aes(xintercept = mean_x, colour = Species))

ggplot2: line for mean for each facet

Shephard answered 26/5, 2017 at 8:48 Comment(3)
Rather than creating a new data set dataInt with the function summarize(Int = mean(Age)), which didn't work for me, use mutate instead.Cohesion
This answer is great as it allows the lines to be flexible based on automatically computed values from the data.Pily
FYI if interested in adjusting properties of the line use syntax like the following: + geom_vline(data = dataLine, aes(xintercept = mean_x), linetype="dashed", size = 1.5, colour = "green")Pily
C
2

Building on @Sébastien Rochette's answer above; Rather than creating a new data frame dataInt with the function summarize(Int = mean(Age)), which didn't work for me as I had multiple levels within each facet plot, use mutate instead.

train3 <- train3 %>%
  group_by(Sex) %>%
  mutate(Int = mean(Age))

And then you can use train3 data-frame in

g<-ggplot(data = train3, aes(x = Age, y = Survived, colour = factor(Pclass))) + 
  facet_wrap(~Sex) +
  geom_vline(data=train3, xintercept=Int)

This works but I fear it may have created a geom_vline for all values, because each mean will be repeated within each level of each factor within the dataframe.

Cohesion answered 7/10, 2019 at 5:14 Comment(0)

© 2022 - 2025 — McMap. All rights reserved.