Plot point markers and lines in different hues but the same style with seaborn
Asked Answered
I

4

34

Given the data frame below:

import pandas as pd
df = pd.DataFrame({
    "n_index": list(range(5)) * 2,
    "logic": [True] * 5 + [False] * 5,
    "value": list(range(5)) + list(range(5, 10))
})

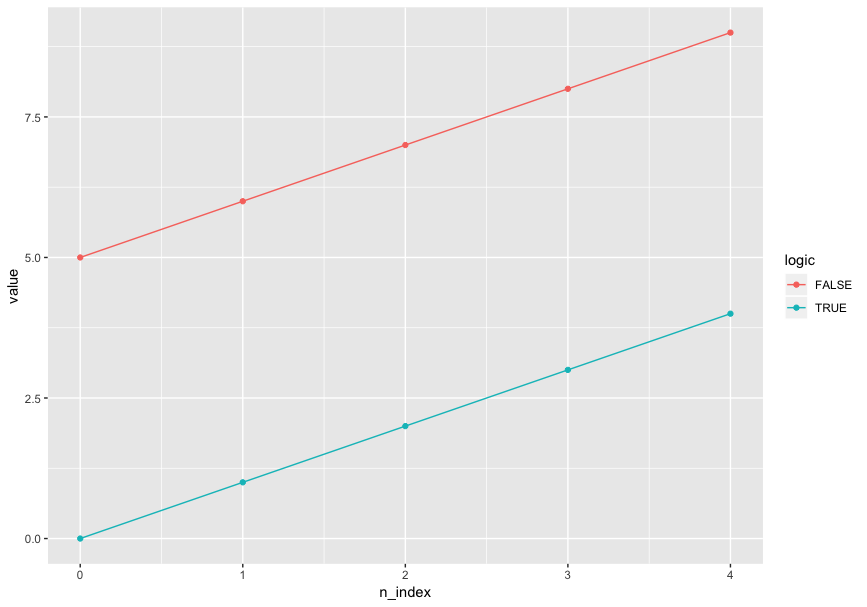
I'd like to use color and only color to distinguish logic in a line plot, and mark points on values. Specifically, this is my desired output (plotted by R ggplot2):

ggplot(aes(x = n_index, y = value, color = logic), data = df) + geom_line() + geom_point()

desired output

I tried to do the same thing with seaborn.lineplot, and I specified markers=True but there was no marker:

import seaborn as sns
sns.set()
sns.lineplot(x="n_index", y="value", hue="logic", markers=True, data=df)

sns no markers

I then tried adding style="logic" in the code, now the markers showed up:

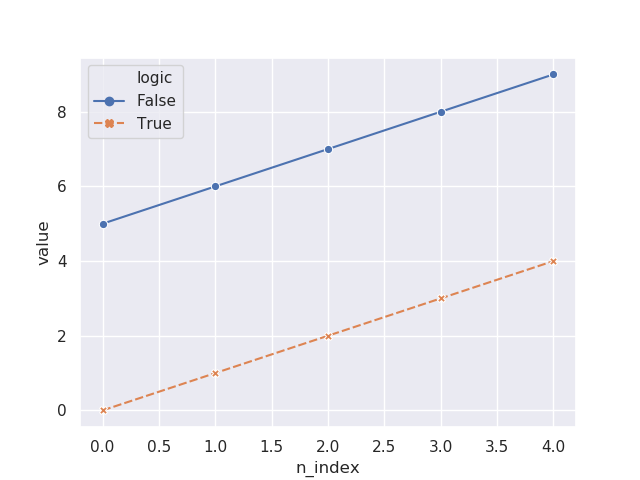
sns.lineplot(x="n_index", y="value", hue="logic", style="logic", markers=True, data=df)

sns with markers 1

Also I tried forcing the markers to be in the same style:

sns.lineplot(x="n_index", y="value", hue="logic", style="logic", markers=["o", "o"], data=df)

sns with markers 2

It seems like that I have to specify style before I can have markers. However, that causes undesired plot output since I don't want to use two aesthetic dimensions on one data dimension. That violates the principles of aesthetic mapping.

Is there any way I can have the lines and points all in the same style but in different colors with seaborn or Python visualization? (seaborn is preferred - I don't like the looping way ofmatplotlib.)

Ivey answered 18/9, 2018 at 11:19 Comment(0)
U
41

You can directly use pandas for plotting.

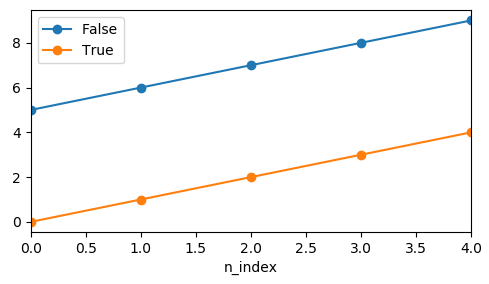
pandas via groupby

fig, ax = plt.subplots()
df.groupby("logic").plot(x="n_index", y="value", marker="o", ax=ax)
ax.legend(["False","True"])

enter image description here

The drawback here would be that the legend needs to be created manually.

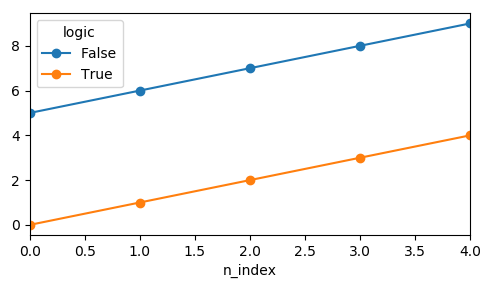
pandas via pivot

df.pivot_table("value", "n_index", "logic").plot(marker="o")

enter image description here

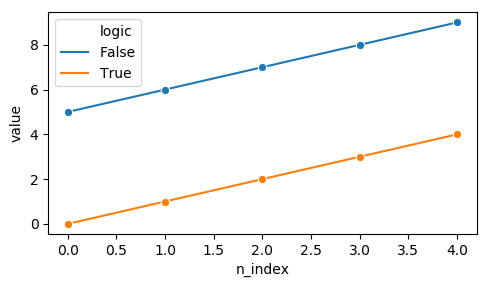
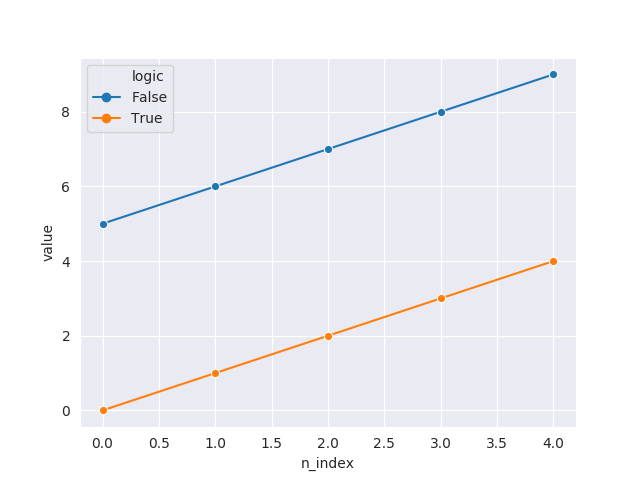
seaborn lineplot

For seaborn lineplot it seems a single marker is enough to get the desired result.

sns.lineplot(x="n_index", y="value", hue="logic", data=df, marker="o")

enter image description here

Unharness answered 18/9, 2018 at 11:44 Comment(2)
Interesting. According to the seaborn.lineplot documentation, markers should be a boolean, list, or dictionary, and setting to True will use default markers. Could it be a bug need reporting?Ivey
Note that I'm not using markers, but marker, which is a matplotlib argument and which is simply passed through to matplotlib's plot function. So the documentation is not wrong, is it? But your use case may be considered a missing feature. Also the fact that the legend ignores the actual artist that is drawn may be considered a bug.Unharness
D
28

See the problem is that people are getting confused between 'markers' and 'marker'. To enable 'marker' set 'marker='o'' not markers.

sns.lineplot(x=range(1,100),y=err,marker='o')

Damick answered 8/8, 2020 at 15:54 Comment(2)
I think this was used in the accepted answer. Is this meant as a comment? You can comment once you have enough reputation. Otherwise explain how this is different from the accepted answer?Diagraph
Accepted answer doesn't gives what's the problem with the question. It doesn't explain where the user is going wrong with the approach and thus creates a confusion that may lead to user accepting the answer and using it directly without ever trying to figure out the problem in his/her code.Damick
O
5

You need to set dashes parameter to False also specify the style of the grid to "darkgrid":

import pandas as pd
import seaborn as sns
import matplotlib.pyplot as plt

df = pd.DataFrame({
    "n_index": list(range(5)) * 2,
    "logic": [True] * 5 + [False] * 5,
    "value": list(range(5)) + list(range(5, 10))
})

sns.set_style("darkgrid")
sns.lineplot(x="n_index", dashes=False, y="value", hue="logic", style="logic", markers=["o", "o"], data=df)
plt.show()

enter image description here

Oriel answered 18/9, 2018 at 11:32 Comment(1)
The gray background grid/frame vanished by doing soSubscapular
S
2

You can set marker='o' in sns.linePlot to draw the marker as a circle for all the different hues, in the appropriate color.

sns.lineplot(x="n_index", y="value", hue="logic", marker="o", data=df)
Someone answered 10/4, 2020 at 23:40 Comment(0)

© 2022 - 2024 — McMap. All rights reserved.