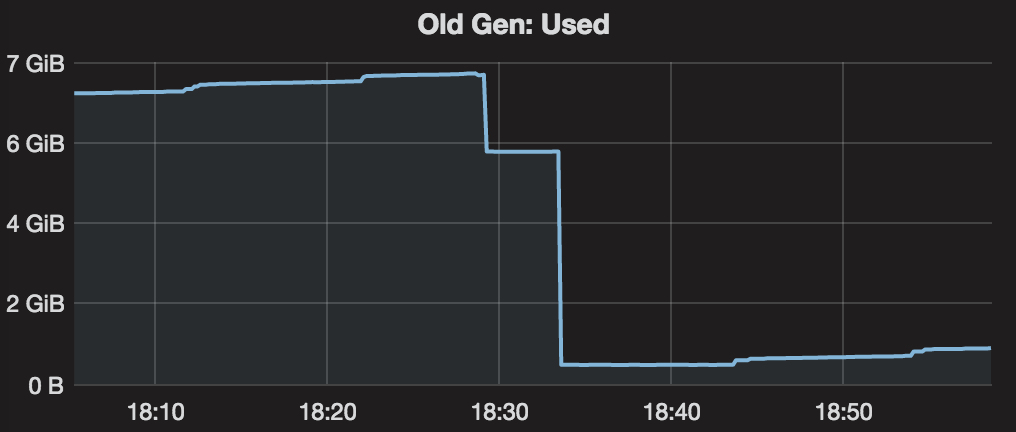
My server is using 1.8.0_92 on CentOS 6.7, GC param is '-Xms16g -Xmx16g -XX:+UseG1GC'. So the default InitiatingHeapOccupancyPercent is 45, G1HeapWastePercent is 5 and G1MixedGCLiveThresholdPercent is 85. My server's mixed GC starts from 7.2GB, but it clean less and less, finally old gen keeps larger than 7.2GB, so it's always try to do concurrent mark. Finally all heap are exhausted and full GC occurred. After full GC, old gen used is under 500MB.
I'm curious why my mixed GC can't collect more, looks like live data is not so much...
I have tried printing g1 related info, and found many messages like below, looks like my old gen contains much live data, but why full GC can collect so much...
G1Ergonomics (Mixed GCs) do not continue mixed GCs, reason: reclaimable percentage not over threshold, candidate old regions: 190 regions, reclaimable: 856223240 bytes (4.98 %), threshold: 5.00 %
Below log is the result of modifying InitiatingHeapOccupancyPercent to 15(start concurrent mark at 2.4GB) to speed up.
### PHASE Post-Marking
......
### SUMMARY  capacity: 16384.00 MB  used: 2918.42 MB / 17.81 %  prev-live: 2407.92 MB / 14.70 %  next-live: 2395.00 MB / 14.62 %  remset: 56.66 MB  code-roots: 0.91 MB
### PHASE Post-Sorting
....
### SUMMARY  capacity: 1624.00 MB  used: 1624.00 MB / 100.00 %  prev-live: 1123.70 MB / 69.19 %  next-live: 0.00 MB / 0.00 %  remset: 35.90 MB  code-roots: 0.89 MB
EDIT:
I try to trigger full GC after mixed GC, it still can reduce to 4xx MB, so looks like my old gen has more data can be collected.
before full gc, the mixed gc log is
 32654.979: [G1Ergonomics (Mixed GCs) start mixed GCs, reason: candidate old regions available, candidate old regions: 457 regions, reclaimable: 2956666176 bytes (17.21 %), threshold: 5.00 %], 0.1106810 secs]
 ....
 [Eden: 6680.0M(6680.0M)->0.0B(536.0M) Survivors: 344.0M->280.0M Heap: 14.0G(16.0G)->7606.6M(16.0G)]
 [Times: user=2.31 sys=0.01, real=0.11 secs]
 ...
 [GC pause (G1 Evacuation Pause) (mixed)
 ...
 32656.876: [G1Ergonomics (CSet Construction) finish adding old regions to CSet, reason: old CSet region num reached max, old: 205 regions, max: 205 regions]
 32656.876: [G1Ergonomics (CSet Construction) finish choosing CSet, eden: 67 regions, survivors: 35 regions, old: 205 regions, predicted pause time: 173.84 ms, target pause time: 200.00 ms]
 32656.992: [G1Ergonomics (Mixed GCs) continue mixed GCs, reason: candidate old regions available, candidate old regions: 252 regions, reclaimable: 1321193600 bytes (7.69 %), threshold: 5.00 %]
 [Eden: 536.0M(536.0M)->0.0B(720.0M) Survivors: 280.0M->96.0M Heap: 8142.6M(16.0G)->6029.9M(16.0G)]
 [Times: user=2.49 sys=0.01, real=0.12 secs]
 ...
 [GC pause (G1 Evacuation Pause) (mixed)
 ...
 32659.727: [G1Ergonomics (CSet Construction) finish adding old regions to CSet, reason: reclaimable percentage not over threshold, old: 66 regions, max: 205 regions, reclaimable: 857822432 bytes (4.99 %), threshold: 5.00 %]
 32659.727: [G1Ergonomics (CSet Construction) finish choosing CSet, eden: 90 regions, survivors: 12 regions, old: 66 regions, predicted pause time: 120.51 ms, target pause time: 200.00 ms]
 32659.785: [G1Ergonomics (Mixed GCs) do not continue mixed GCs, reason: reclaimable percentage not over threshold, candidate old regions: 186 regions, reclaimable: 857822432 bytes (4.99 %), threshold: 5.00 %]
 [Eden: 720.0M(720.0M)->0.0B(9064.0M) Survivors: 96.0M->64.0M Heap: 6749.9M(16.0G)->5572.0M(16.0G)]
 [Times: user=1.20 sys=0.00, real=0.06 secs]
EDIT: 2016/12/11
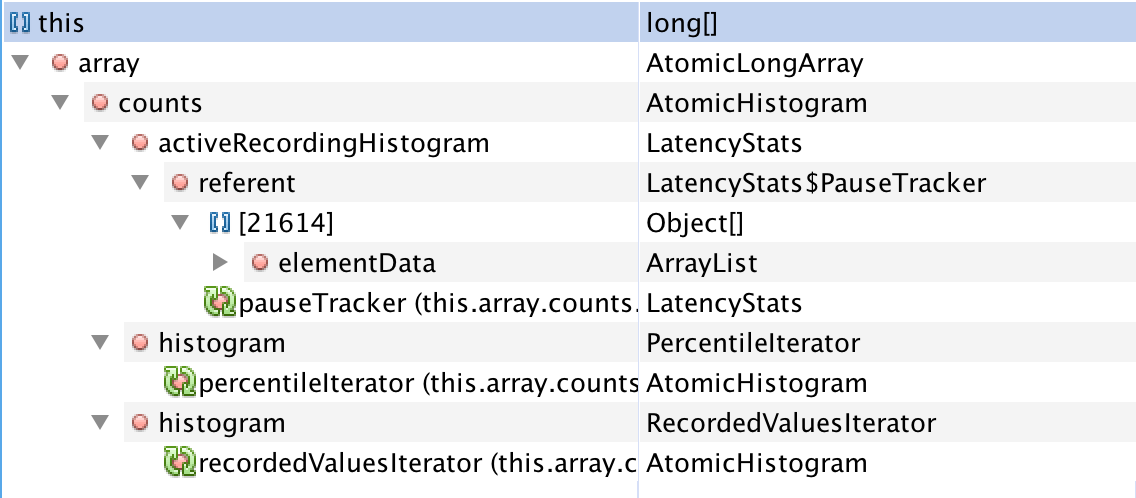
I have dumped the heap from another machine with -Xmx4G.
I used lettuce as my redis client, and it has tracking featured using LatencyUtils. It make LatencyStats(which contains some long[] with near 3000 elements) instances weak referenced every 10 mins(Reset latencies after publish is true by default, https://github.com/mp911de/lettuce/wiki/Command-Latency-Metrics). So it will make lots of weak reference of LatencyStats after long time.
Currently I don't need tracking from lettuce, so just disable it and it doesn't have full GC anymore. But not sure why mixed gc doesn't clear them.


-XX:+UnlockDiagnosticVMOptions -XX:+G1PrintHeapRegions -XX:+G1PrintRegionLivenessInfomight provide some insight. I guess you got humongous allocations or some allocation patterns that somehow lead to incorrect liveness estimates (soft refs maybe)? – Dercy### PHASE Post-Markingis G1PrintRegionLivenessInfo, looks like it still has more than 1GB live data. And humongous doesn't show many[Humongous Total: 1] [Humongous Candidate: 1]. I will check how to know if its from soft refs..(any doc about this?) – JackbootSoftRefLRUPolicyMSPerMB.. – JackbootG1MixedGCLiveThresholdPercent– Dercy-XX:+PrintGCDetailsif you haven't already. – Dercy