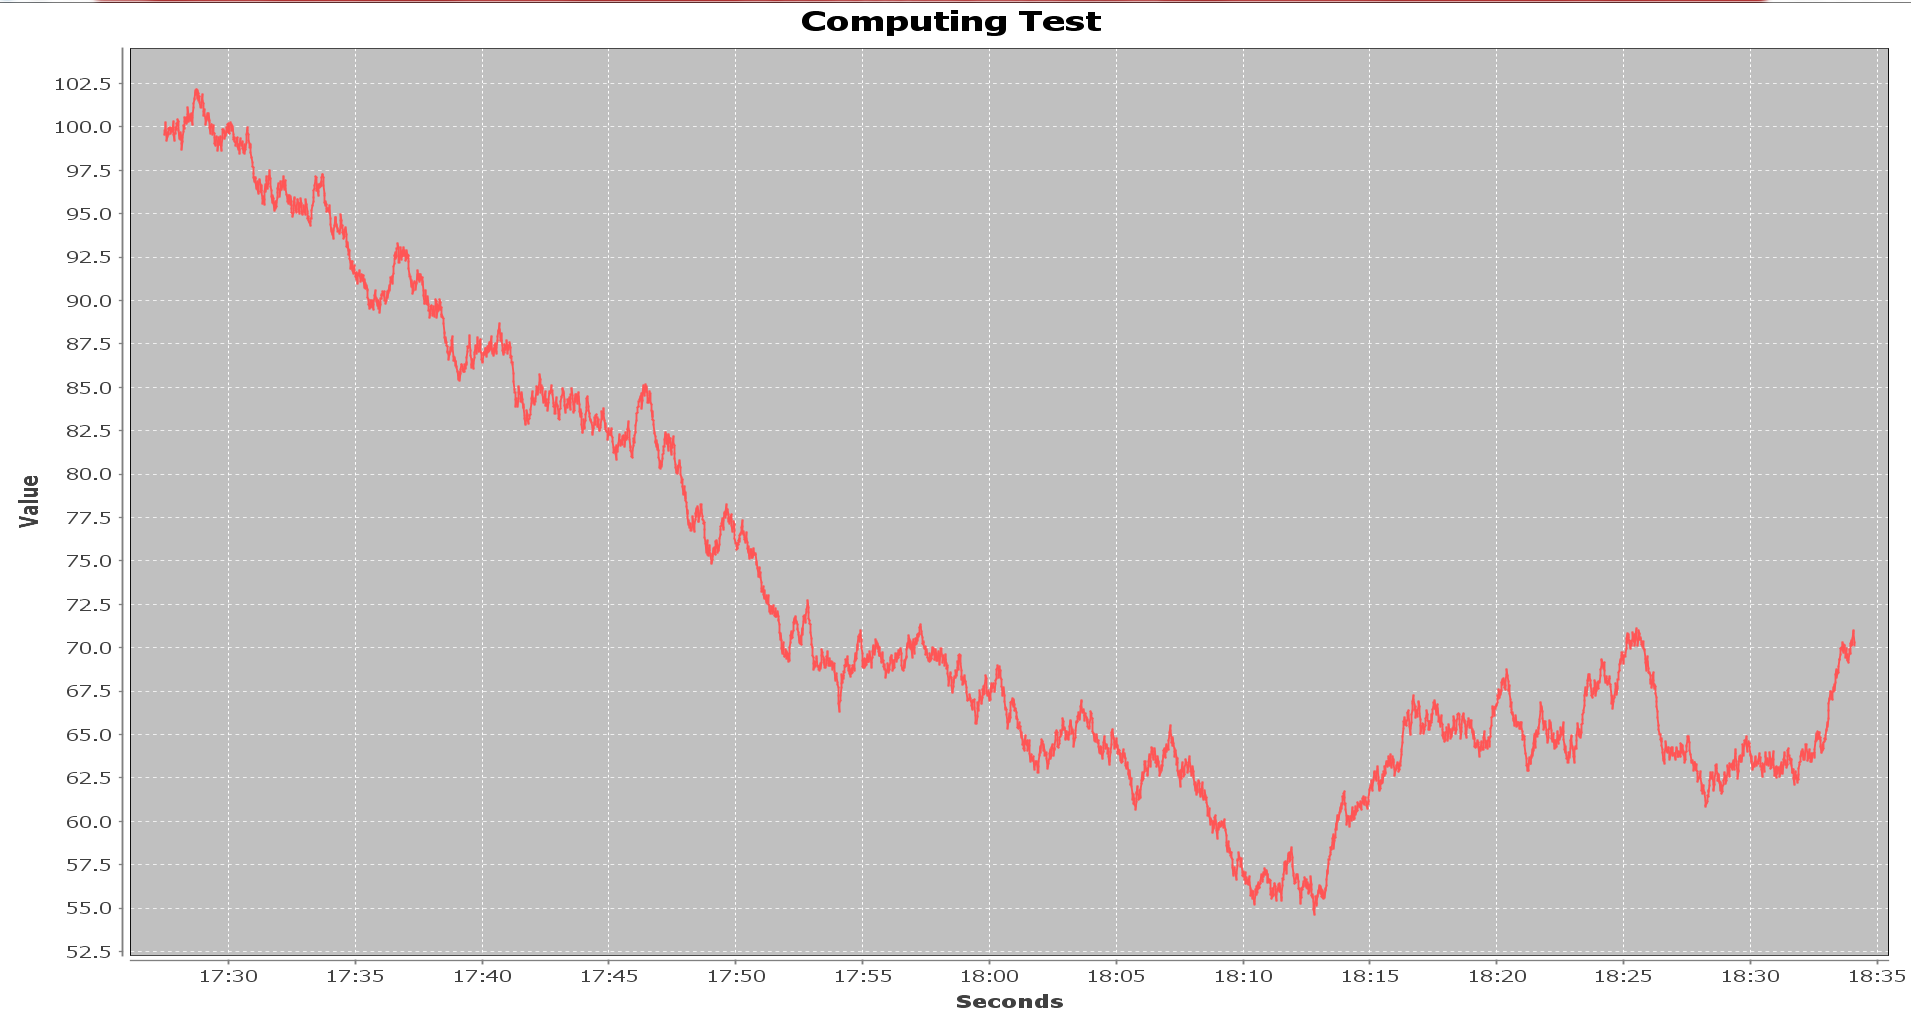
I want to implement a trend graph with real time data coming continuously,for which am having time on x-axis with format "HH:MM:SS". Now my requirement is to have adjustable scale like 10min or 15min etc....And also how could i limit the time values on x-axis ?
Please help me. Thanks!
import org.jfree.chart.ChartFactory;
import org.jfree.chart.ChartPanel;
import org.jfree.chart.JFreeChart;
import org.jfree.data.general.SeriesException;
import org.jfree.data.time.Second;
import org.jfree.data.time.TimeSeries;
import org.jfree.data.time.TimeSeriesCollection;
import org.jfree.data.xy.XYDataset;
import org.jfree.ui.ApplicationFrame;
import org.jfree.ui.RefineryUtilities;
public class TimeSeries_AWT extends ApplicationFrame
{
  public TimeSeries_AWT( final String title )
  {
   super( title );
   final XYDataset dataset = createDataset( );
   final JFreeChart chart = createChart( dataset );
   final ChartPanel chartPanel = new ChartPanel( chart );
   chartPanel.setPreferredSize( new java.awt.Dimension( 560 , 370 ) );
  chartPanel.setMouseZoomable( true , false );
  setContentPane( chartPanel );
 }
 private XYDataset createDataset( )
 {
 final TimeSeries series = new TimeSeries( "Random Data" );
 Second current = new Second( );
 double value = 100.0;
 for (int i = 0; i < 4000; i++)
 {
 try
 {
  value = value + Math.random( ) - 0.5;
  series.add(current, new Double( value ) );
   current = ( Second ) current.next( );
 }
catch(SeriesException e )
  {
   System.err.println("Error adding to series");
  }
 }
  return new TimeSeriesCollection(series);
  }
  private JFreeChart createChart( final XYDataset dataset )
 {
  return ChartFactory.createTimeSeriesChart(
"Computing Test",
  "Seconds",
 "Value",
 dataset,
false,
false,
 false);
 }
  public static void main( final String[ ] args )
 {
   final String title = "Time Series Management";
   final TimeSeries_AWT demo = new TimeSeries_AWT( title );
   demo.pack( );
   RefineryUtilities.positionFrameRandomly( demo );
   demo.setVisible( true );
 }
}
If you see output, the time is constant just static not changing dynamically. and while if time updates dynamically,i want the scale or tickunits to be adjusted dynamically at runtime like for example in the output graph the scale time is 5min. but i want that to be controlled at runtime to be anything like 10min,20min,40min etc...
And another thing is in the output graph we can see 14 values on x-axis.which changes automatically when the graph is resized.but i want to control how many to be seen on the x-axis means i want to show some particular x time values on x-axis.which should also be configurable at launch of application.

