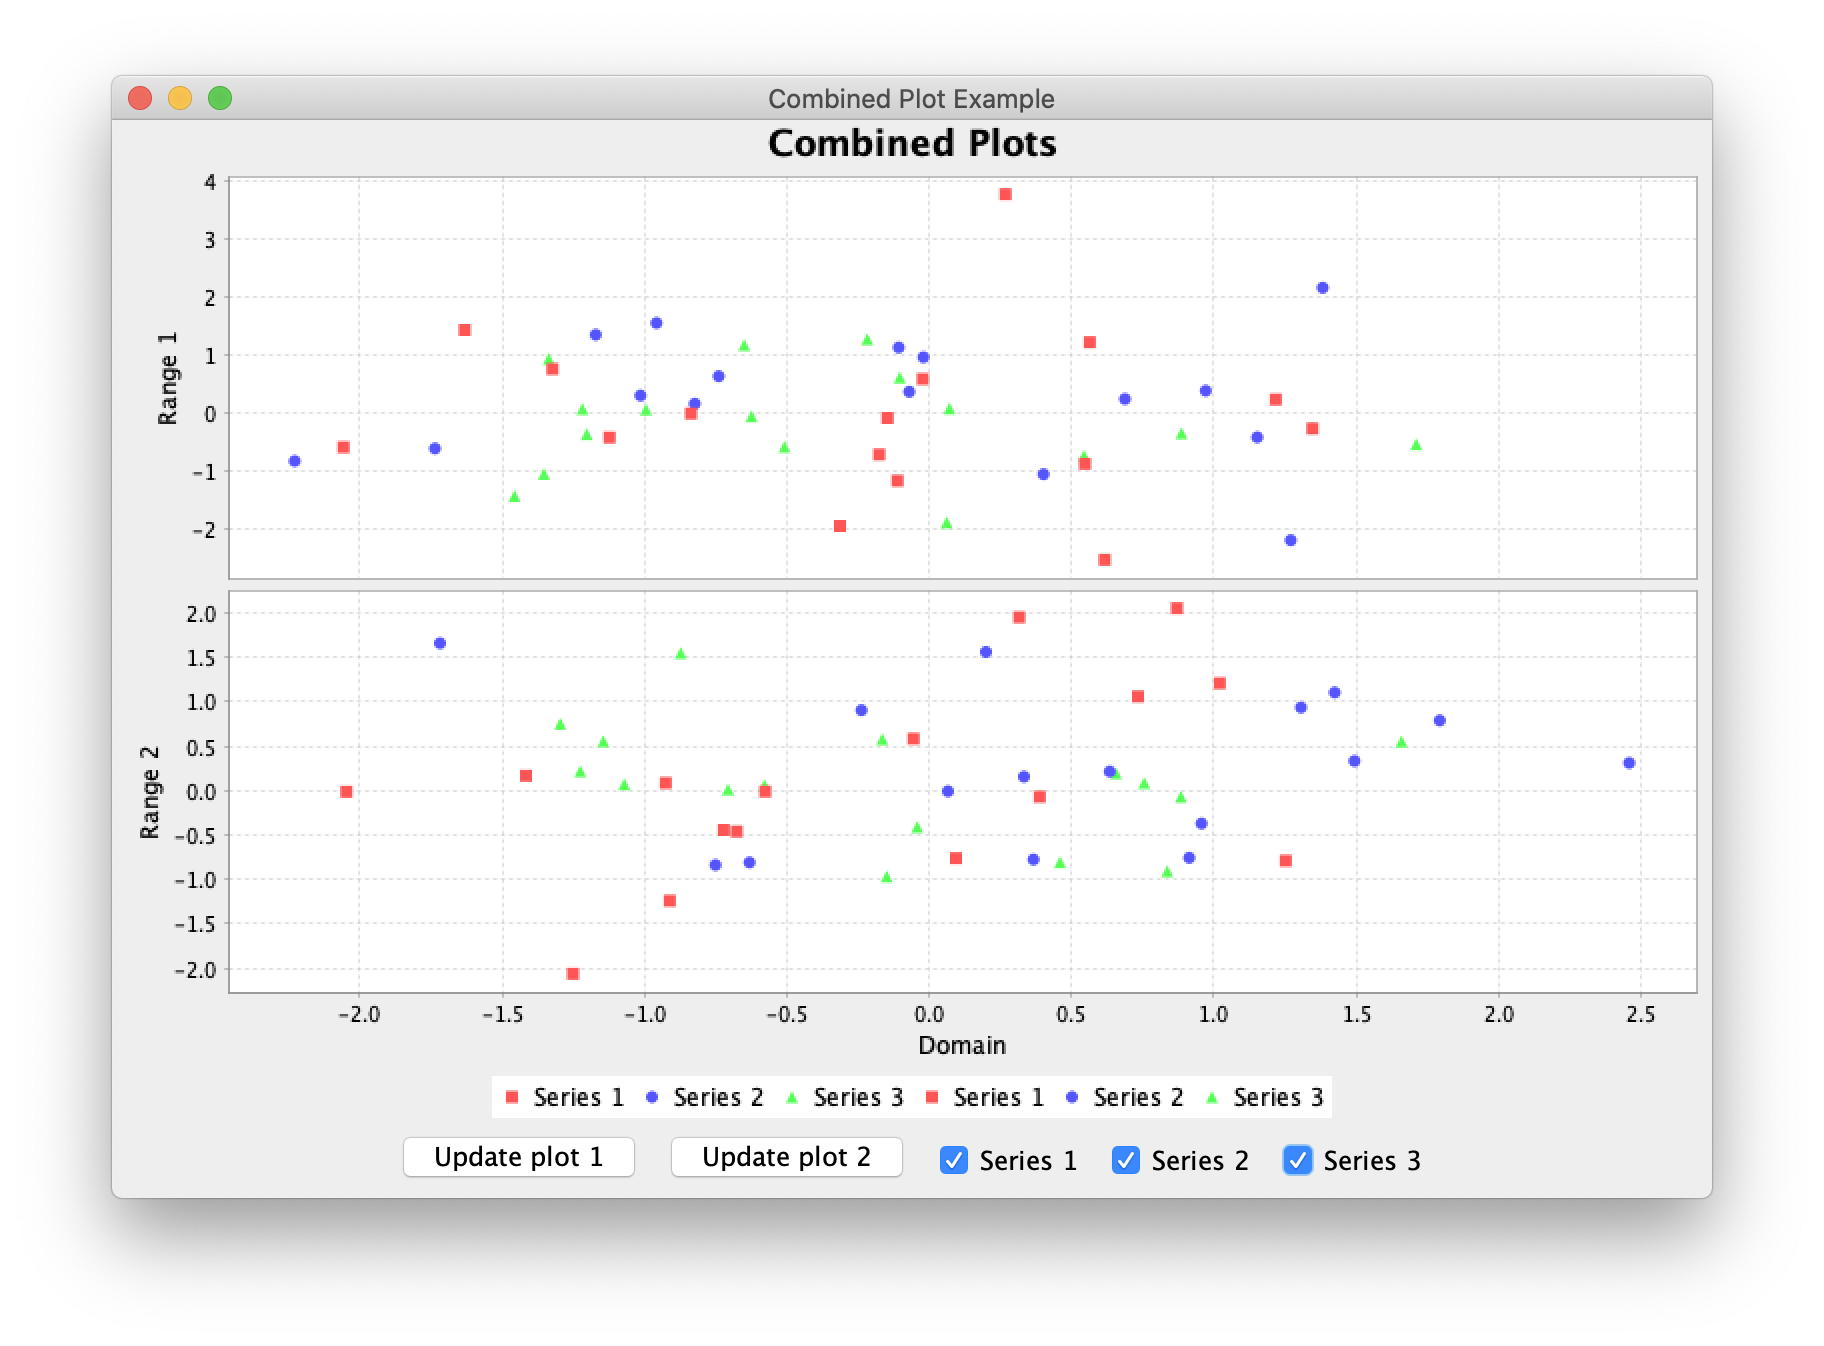
I want to create multiple ScatterPlot chart on JFreeChart and to do so I've used the function createCombinedChart(). With my current code I get multiple charts just like the CombinedXYPlotDemo1 that you can found, but those are line chart and I want them as ScatterPlot.
I've found this question but after trying I can't figure out how to make it work (maybe I just don't understand how to use it)
here is a sample of my code (it's very similar to the Demo code + I retrieve from my database and added a Time Axis).
public class DatabaseChart extends ApplicationFrame {
    private static final long serialVersionUID = 1L;
    public DatabaseChart(final String title) {
        super(title);
        final JFreeChart chart = createCombinedChart();
        final ChartPanel panel = new ChartPanel(chart, true, true, true, true, true);
        panel.setPreferredSize(new java.awt.Dimension(1000, 500));
        setContentPane(panel);
}
/**
 * Creates a combined chart.
 *
 * @return the combined chart.
 */
private JFreeChart createCombinedChart() {

    // create subplot 1
    final XYDataset data1 = createDataset1();
    final XYItemRenderer renderer1 = new StandardXYItemRenderer();
    final NumberAxis rangeAxis1 = new NumberAxis("Axis");
    rangeAxis1.setLabelPaint(Color.RED);
    final XYPlot subplot1 = new XYPlot(data1, null, rangeAxis1, renderer1);
    subplot1.setRangeAxisLocation(AxisLocation.BOTTOM_OR_LEFT);

    // create subplot 2
    [...]

    // create subplot 3
    [...]

    // parent plot...
    final CombinedDomainXYPlot plot = new CombinedDomainXYPlot(new NumberAxis("Domain"));
    //plot.setRenderer(new XYLineAndShapeRenderer(false,true)); ??
    plot.setGap(25.0);

    // add the subplots...
    ValueAxis domainAxis = new DateAxis("");
    plot.setDomainAxis(domainAxis);
    plot.add(subplot1, 1);
    plot.add(subplot2, 1);
    plot.add(subplot3, 1);
    plot.setOrientation(PlotOrientation.VERTICAL);

    // return a new chart containing the overlaid plot...
    return new JFreeChart("Name",JFreeChart.DEFAULT_TITLE_FONT, plot, false);
}

/**
 * Creates a sample dataset.
 *
 * @return Dataset1.
 */
private JDBCXYDataset createDataset1() {
    [...]
 }
//Same for Dataset2 and Dataset3

public static void main(final String[] args) {
  [...]
}}
So is there a simple way of converting the line chart that I get to ScatterPlot chart ?

