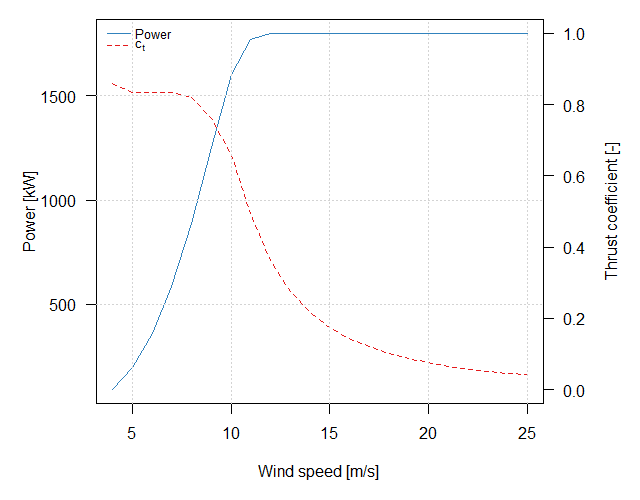
If you don't give some arguments (e.g., mar, xlim, ylim),
plot(pc) uses par(mar = c(5, 5, 1, 5) and treats data.ranges as xlim and ylim. By using these properties, you can use grid().
pc.data = pc("Vestas_V90_1.8MW.wtg")
plot(pc.data)
par(mar = c(5, 5, 1, 5), new=T)                           # set par() and order to overlay
plot(pc.data[[1]], pc.data[[2]], type="n", ann=F, axes=F) # nothing but setting xy-cordinates
grid(NULL)                                     # here, the same xy-coordinates are reproduced

# If you want to adjust grid lines to right y-axis, use berow code
:
par(mar = c(5, 5, 1, 5), new=T)                   # plot(pc) uses right ylim=c(0,1)
plot(pc.data[[1]], pc.data[[2]], ylim=c(0,1), type="n", ann=F, axes=F)
grid(NULL)                                        # the xy(right)-coordinates are reproduced

# If you plot pc.object having single y-axis, use mar = c(5, 5, 1, 1)
![enter image description here]()


