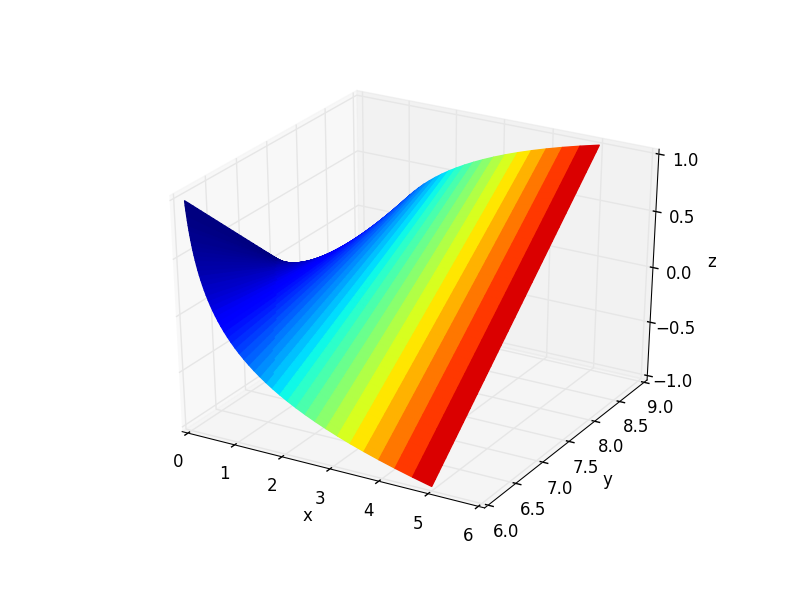
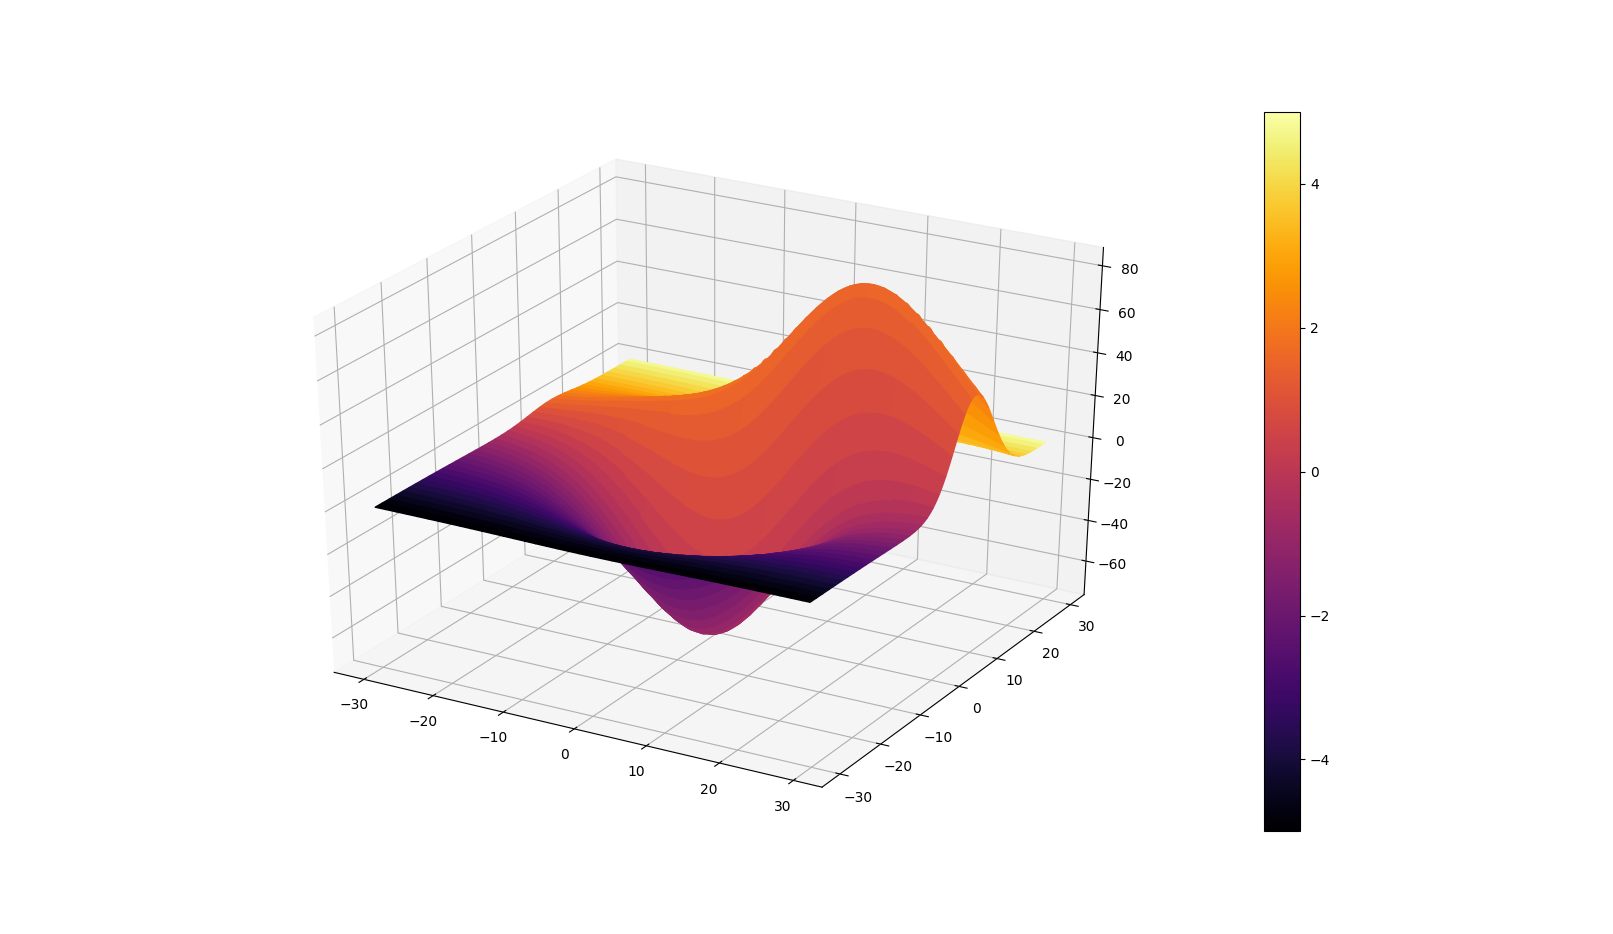
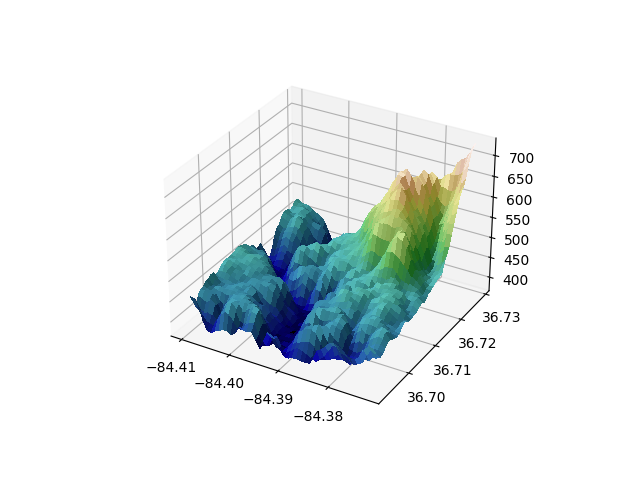
I'm trying to plot a 3d surface where each of the three dimensions in a separate array of values and the colouring of the surface at each coordinate is a function of x,y,z. A sort of numpy.pcolormesh but in 4D, rather than 3D. The 3D plot is given by:
from mpl_toolkits.mplot3d import Axes3D
from matplotlib import cm
fig = plt.figure()
ax = fig.gca(projection='3d')
x = np.logspace(-1.,np.log10(5),50)
y = np.linspace(6,9,50)
z = np.linspace(-1,1,50)
colors = LikeBeta(y,range(50),range(50))
ax.plot_trisurf(x,y,z,cmap=colors,linewidth=0.2)
where
def LikeBeta(rho0,r0,beta):
    M0 = 10**rho0*r0_array[r0]**3
    I = cst*M0*sigma_los_beta[beta,:,r0]
    S = dv**2+I
    res = (np.log(S) + (v-u)**2/S).sum()
    return res/2.
Probably the cmap=colors is wrong, but the problem lies elsewhere. I get the following error:
----> 8 colors = LikeBeta(y,range(50),range(50))
----> 4     I = cst*M0*sigma_los_beta[beta,:,r0]
    ValueError: operands could not be broadcast together with shapes (50,) (50,353)
Indeed sigma_los_beta is an array that I evaluate separately and has shape (50,353,50) and those 353 are data that I must have.
How can I cast this function into a form that is compatible with the other entries of plot_trisurf?
Sorry, but I can't supply a minimal working code, because dv,v and u are data. Thank you very much for your help. Cheers


