Know of any Java garbage collection log analysis tools? [closed]
Asked Answered
K

12

56

I'm looking for a tool or a script that will take the console log from my web app, parse out the garbage collection information and display it in a meaningful way.

I'm starting up on a Sun Java 1.4.2 JVM with the following flags:

-verbose:gc -XX:+PrintGCTimeStamps -XX:+PrintGCDetails

The log output looks like this:

54.736: [Full GC 54.737: [Tenured: 172798K->18092K(174784K), 2.3792658 secs] 257598K->18092K(259584K), [Perm : 20476K->20476K(20480K)], 2.4715398 secs]

Making sense of a few hundred of these kinds of log entries would be much easier if I had a tool that would visually graph garbage collection trends.

Kynthia answered 12/2, 2009 at 15:35 Comment(1)
There's a commercial product JClarity Censum, which i haven't tried. However, this talk by its author was quite informative on Java GC in general: infoq.com/presentations/Visualizing-Java-GCHy
G
17

IBM's GC toolkit does exactly what you ask.

https://www.ibm.com/developerworks/java/jdk/tools/gcmv/

I'm not sure if it's compatible with GC logs from Sun's JVM though.

Gemology answered 12/2, 2009 at 17:26 Comment(3)
This one is not perfect, but it does what I need it to do. It seems to be geared towards the IBM JDK, but it mostly works with the java GC log format. There are a couple of bits of information that don't get parsed out, but most of the data is there. Thanks!Kynthia
IBM now delivers a suite of tools bundled in a really large package "IBM Support Assistant" www-01.ibm.com/support/docview.wss?uid=swg27023689 For GC log analysis, you have to use the "Garbage Collection and Memory Visualizer (GCMV)"Nickelsen
IBM provides also "IBM Pattern Modeling and Analysis Tool for Java Garbage Collector (PMAT)" (last updated november 2012) ibm.com/developerworks/community/groups/service/html/…Anvers
F
33

gcviewer does what you want.

Flunky answered 13/2, 2009 at 10:58 Comment(3)
gcviewver was released in 2008. Can it parse Sun JVM 1.6 logs correctly? For me it generates a lot of NumberFormatExceptions but shows some information. Question is: can I trust it?Coaming
So far I think you can trust it.Flunky
I really recommend to get the latest version from github.com/chewiebug/GCViewerNickelsen
G
17

IBM's GC toolkit does exactly what you ask.

https://www.ibm.com/developerworks/java/jdk/tools/gcmv/

I'm not sure if it's compatible with GC logs from Sun's JVM though.

Gemology answered 12/2, 2009 at 17:26 Comment(3)
This one is not perfect, but it does what I need it to do. It seems to be geared towards the IBM JDK, but it mostly works with the java GC log format. There are a couple of bits of information that don't get parsed out, but most of the data is there. Thanks!Kynthia
IBM now delivers a suite of tools bundled in a really large package "IBM Support Assistant" www-01.ibm.com/support/docview.wss?uid=swg27023689 For GC log analysis, you have to use the "Garbage Collection and Memory Visualizer (GCMV)"Nickelsen
IBM provides also "IBM Pattern Modeling and Analysis Tool for Java Garbage Collector (PMAT)" (last updated november 2012) ibm.com/developerworks/community/groups/service/html/…Anvers
S
12

I think some people are adding Java probes which don't really parse garbage collection logs as the question states...

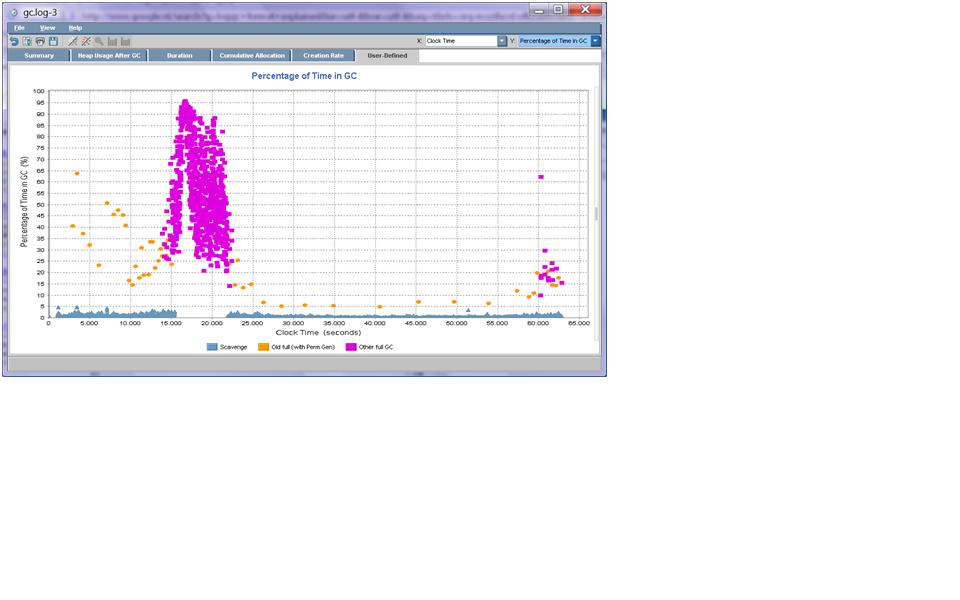
I've tried others (gcviewer, gchisto, IBM's) and the best tool I found for analyzing GC logs is HPjmeter

It is mainly for HP-UX JVMs, but it also usually works with Sun JVMs and does a great job.

alt text
(source: xebia.com)

Swayne answered 6/4, 2010 at 15:35 Comment(7)
I am playing with HPjmeter 4.1.00.00 and I can't open Sun JDK log files with it. They have the format mentioned by braveterry in his question.Coaming
It 'usually' works for Sun JVMs but I've had problems reading some CMS GC messages which I had to filter to load the file. Which JDK version are logs from? Which GC args are used to start the JVM?Swayne
Sun JDK 1.6u27, -verbose:gc -XX:+PrintGCDetails. But the problem is more trivial: *.log files are not listed in program available filters, so HPjmeter can't open it. When I rename it, HPjmeter fails. How do you name the files, produced by GC?Coaming
1) Change file type combo box to show all files 2) Use -Xloggc:<file> instead of -verbose:gcSwayne
Just rename the Sun JDK verbose GC logs to .hprof from .log and you will be able to load them in HPJMeter. It's a brilliant tool. GCViewer barfed on some of the Sun JDK 1.6 logs but not this.Loera
I get "No useful data in file" error, even after renaming the file .hprof. The problem is of course not the filename, as I can make it open the .log file also, by just entering the name.Vincent
I used in the past, HP Jmeter doesn't support SUN JDK GC log nowadays.Deangelis
G
10

I tried a online tool http://gceasy.io , it can read my sun jdk 1.8 gc log.

Ginn answered 25/12, 2015 at 8:0 Comment(1)
Seems to work for JRockit too.Crowned
B
7

Even better than jconsole is visualvm, which is developed and distributed freely by Sun. It has a GC analyzing plugin called gchisto which might help you.

Edit: Sorry, I didn't see your JDK 1.4.2 requirement. In that case visualvm won't help you, alas.

Bardo answered 12/2, 2009 at 15:47 Comment(2)
GC Histo is good. But they should also add the heap size to analysis.Tarsia
@fred-o: visualvm looks great, but how to open GC logs in it?Coaming
H
7

The most powerful tool I've found to work with both IBM and Hotspot JVM logs and visualize them is IBM's PMAT: https://www.ibm.com/developerworks/mydeveloperworks/groups/service/html/communityview?communityUuid=22d56091-3a7b-4497-b36e-634b51838e11

I find it both faster and gives more details than the tool in IBM Support Assistant. It is being continually updated, lastly July'12.

However seems to have some problems parsing logs with policy CMS but hopefully that can be fixed.

PrintGCStats is pretty good too, and gives good statistics, but not for visualization over time, that needs some work.

Hunkydory answered 18/7, 2012 at 8:58 Comment(0)
D
5

I use YourKit java profiler, which lets you measure this sort of thing, and much more, but using it's own format rather than analysing the log. It can do more under Java 5, but should work under 1.4.

Darter answered 12/2, 2009 at 15:43 Comment(0)
S
3

Try VisualGC from Sun. There are JDK 4 and 5 versions that give you a nice visual of what's going on in the eden, generational, and perm spaces. You need to add a JAR and get a PID and Bob's your uncle.

Sarnoff answered 12/2, 2009 at 15:44 Comment(3)
VisualGC is also available as a graphical plugin in VisualVM but it only works "live" and as far as I know it is not able to process a GC log file.Nickelsen
Yes, I'd recommend Visual VM now, too. I wrote this three years ago; the world has changed. I don't revisit every answer and keep them up to date.Sarnoff
I agree. I just want to point that the question is about analyzing GC log file "offline" whereas VisualGC is a "live" tool.Nickelsen
R
3

A few years ago, John Coomes (Hotspot GC group) had released PrintGCStats, an awk script to "summarize statistics about garbage collection, in particular gc pause time totals, averages, maximum and standard deviations.". A copy of the script is hosted on java.net : http://java.net/projects/printgcstats

Rawinsonde answered 27/7, 2011 at 7:39 Comment(0)
M
2

jconsole can help you a lot, but I think it's Java 5 and later only. Once I heard someone of SUN speaking at our university and he said that Java 6's garbage collector is A LOT better than the old ones which needed complicated tuning nearly all the time for big applications. Java 6 GC seems to scale a lot better on SMPs.

Michellmichella answered 12/2, 2009 at 15:40 Comment(1)
Does jconsole support analysis of offline log files? I see there is only Connect menu.Coaming
B
2

gchisto plugin for VisualVM doesn't work https://gchisto.dev.java.net/

I have a file with all details of printgc for jdk1.6 but couldn't find a tool to read that. Previously with jdk1.5 we used HPjmeter it worked fine, but now with jdk1.6 it doesn't

Tried following: IBM Pattern Modeling and Analysis Tool for Java Garbage Collector -- it doesn't recognizes the file. GCCollector doesn't work, it keep on reading file for analysis.

Bruner answered 12/11, 2010 at 7:29 Comment(0)
V
1

How about trying out some profiling tool like JProbe Freeware (Eclipse plug-in).

Vestryman answered 12/2, 2009 at 15:39 Comment(1)
You cannot profile your production environment. Load a test environment with relevant scenarios is the first step for gc/memory tuning but then you have to validate that the tuning has the expected effect in production thanks to GC log analysisNickelsen

© 2022 - 2024 — McMap. All rights reserved.