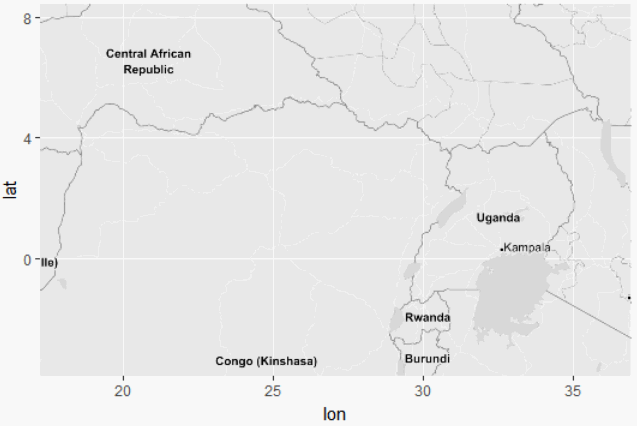
I'm trying to plot a map from ggmap in front of a raster. This map has a lot of white area, so I wanted to make the white area transparent so I can plot the remaining elements on top of a colorful raster, using ggplot. Here is the map:
Fulanus_bbox <- c(left = 17.250000, bottom = -3.916667, right = 36.916667, top = 8.416667)
Fulanus_big <- ggmap::get_map(location = Fulanus_bbox, source = "stamen", maptype = "toner-lite")
map <- ggmap::ggmap(Fulanus_big)
map
All I could think of were this two solutions, which I didn't expect to work and they didn't. I have tried replacing the hex codes on the map:
map_colors <- map$layers[[2]]$geom_params$raster
map_colors[map_colors == '#FFFFFF'] <- '#00FFFFFF'
map$layers[[2]]$geom_params$raster <- map_colors
map
I have also tried transforming the colors into a raster to see if the pattern was maintained:
maprow <- nrow(map_colors)
mapcol <- ncol(map_colors)
map_factors <- as.factor(map_colors)
map_numeric <- as.numeric(map_factors)
map_matrix <- matrix(map_numeric, nrow = maprow, ncol = mapcol)
map_raster <- raster::raster(map_matrix)
map_raster <- raster::setExtent(map_raster, Fulanus_bbox)
raster::crs(map_raster) <- "+proj=longlat +datum=WGS84 +no_defs +ellps=WGS84 +towgs84=0,0,0 "
raster::plot(map_raster)
Is that possible to do? If it is, how?

