Diagnose and solve performance problems in net-core
Unlike the .NET Framework on Windows, .NET Core doesn’t emit perf
counters. Instead, we had introduced a new way of emitting metrics in
.NET Core via the EventCounter API.
EventCounters offer an improvement over Windows perf counters as these
are now usable on all OSes where .NET Core is supported.
EventCounters
EventCounters are .NET APIs used for lightweight, cross-platform, and
near real-time performance metric collection. EventCounters were added
as a cross-platform alternative to the "performance counters" of .NET
Framework on Windows.
You can use these performance diagnostic tools designed for .NET Core :
Example Usage of dotnet-counters:
Install the tool
dotnet tool install --global dotnet-counters
Run command below to make dotnet-counters create a diagnostics
socket named myport.sock and wait for a connection.
dotnet-counters collect --diagnostic-port myport.sock
Set DOTNET_DiagnosticPorts=myport.sock in your application's
environment variables which will enable dotnet-counters to start
collecting counters on your app and run your app.
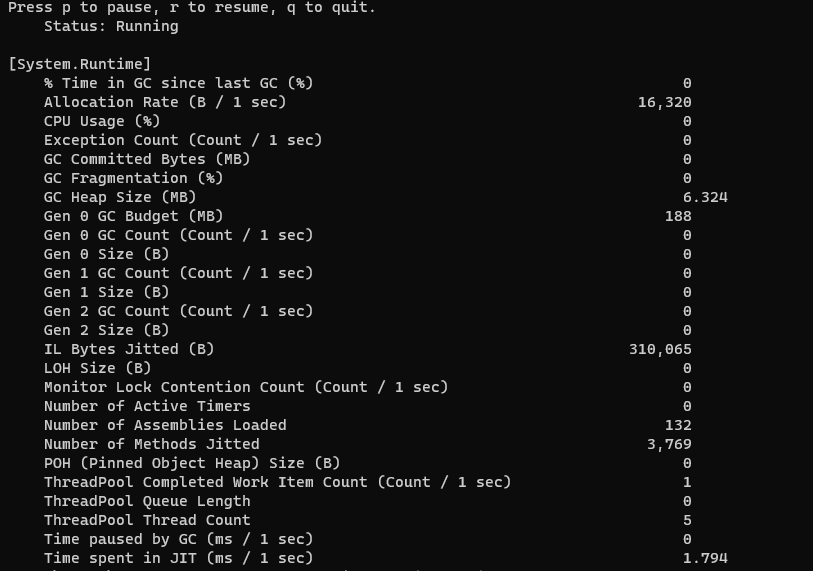
Output of the command in 2:
![enter image description here]()
By default dotnet-counters will collect/monitor the Well-known EventCounters, The counters I believe you are specifically interested in are the System.Runtime counters i.e Monitor Lock Contention Count,ThreadPool Queue Length and ThreadPool Thread Count (These are monitored/collected by default).

