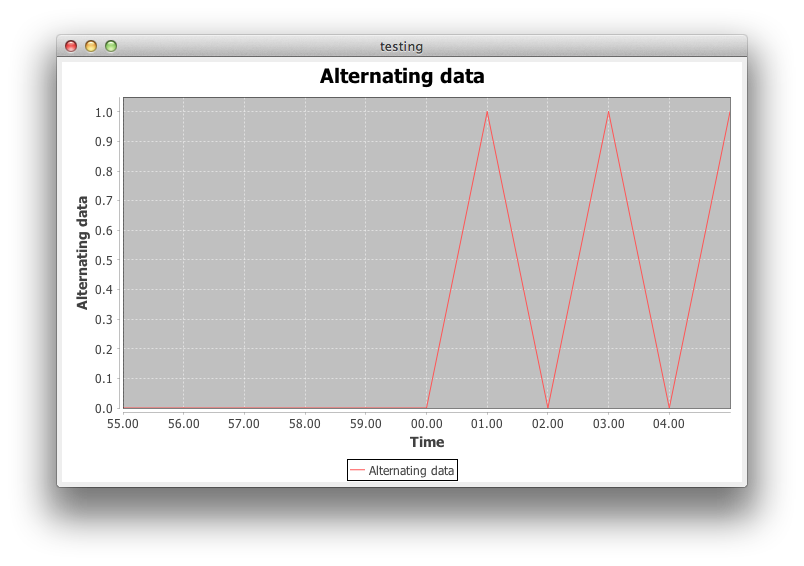
Here is code based on @trashgod's example about real time plotting:
import java.awt.EventQueue;
import java.awt.event.ActionEvent;
import java.awt.event.ActionListener;
import java.text.SimpleDateFormat;
import javax.swing.JFrame;
import javax.swing.JPanel;
import javax.swing.Timer;
import org.jfree.chart.ChartFactory;
import org.jfree.chart.ChartPanel;
import org.jfree.chart.JFreeChart;
import org.jfree.chart.axis.DateAxis;
import org.jfree.chart.plot.XYPlot;
import org.jfree.data.time.DynamicTimeSeriesCollection;
import org.jfree.data.time.Second;

/**
 * @see https://mcmap.net/q/429254/-jfreechart-how-to-show-real-time-on-the-x-axis-of-a-timeseries-chart
 */
public class DynamicTimeSeriesChart extends JPanel {

private static final long serialVersionUID = 5128935838291298041L;
private final DynamicTimeSeriesCollection dataset;
private final JFreeChart chart;

public DynamicTimeSeriesChart(final String title) {
    dataset = new DynamicTimeSeriesCollection(1, 1000, new Second());
    dataset.setTimeBase(new Second(0, 0, 0, 1, 1, 2014));
    dataset.addSeries(new float[1], 0, title);
    chart = ChartFactory.createTimeSeriesChart(
        title, "Time", title, dataset, true, true, false);
    final XYPlot plot = chart.getXYPlot();
    DateAxis axis = (DateAxis) plot.getDomainAxis();
    axis.setFixedAutoRange(10000);
    axis.setDateFormatOverride(new SimpleDateFormat("ss.SS"));
    final ChartPanel chartPanel = new ChartPanel(chart);
    add(chartPanel);
}

public void update(float value) {
    float[] newData = new float[1];
    newData[0] = value;
    dataset.advanceTime();
    dataset.appendData(newData);
}

public static void main(String[] args) {
    EventQueue.invokeLater(new Runnable() {

        @Override
        public void run() {
            JFrame frame = new JFrame("testing");
            frame.setDefaultCloseOperation(JFrame.EXIT_ON_CLOSE);
            final DynamicTimeSeriesChart chart
                = new DynamicTimeSeriesChart("Alternating data");
            frame.add(chart);
            frame.pack();
            Timer timer = new Timer(1000, new ActionListener() {
                private boolean b;

                @Override
                public void actionPerformed(ActionEvent e) {
                    chart.update(b ? 1 : 0);
                    b = !b;
                }
            });
            timer.start();
            frame.setVisible(true);
        }
    });
}
}
After running the Java, I still don't understand why the graph starts at 40 seconds, although the new Seconds start from 0?
Ran through code; can't find any settings to start at 40 seconds.
Also, how to scroll back graph to see previous data.

