Combine multiple line labels in legend
Asked Answered
S

10

36

I have data that results in multiple lines being plotted, I want to give these lines a single label in my legend. I think this can be better demonstrated using the example below,

a = np.array([[ 3.57,  1.76,  7.42,  6.52],
              [ 1.57,  1.2 ,  3.02,  6.88],
              [ 2.23,  4.86,  5.12,  2.81],
              [ 4.48,  1.38,  2.14,  0.86],
              [ 6.68,  1.72,  8.56,  3.23]])

plt.plot(a[:,::2].T, a[:, 1::2].T, 'r', label='data_a')

plt.legend(loc='best')

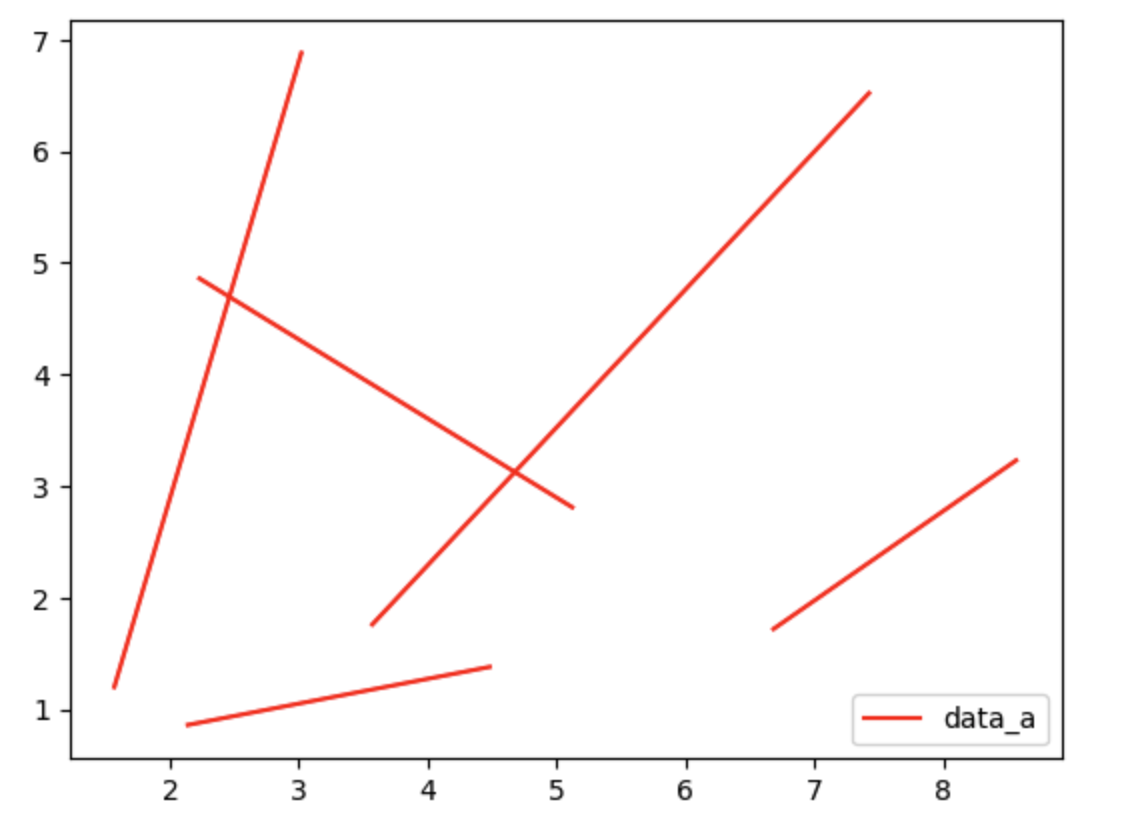
As you can see at Out[23] the plot resulted in 5 distinct lines. The resulting plot looks like this legend of multiple line plot

Is there any way that I can tell the plot method to avoid multiple labels? I don't want to use custom legend (where you specify the label and the line shape all at once) as much as I can.

Slifka answered 13/10, 2014 at 10:10 Comment(1)
You need newscast to create a custom legend. Can't paste a link because my phone is being crap. Google "matplotlib manually create legend". There is an SO answer which has everything you need a couple of hits down.Seessel
S
25

I'd make a small helper function personally, if i planned on doing it often;

from matplotlib import pyplot
import numpy


a = numpy.array([[ 3.57,  1.76,  7.42,  6.52],
                 [ 1.57,  1.2 ,  3.02,  6.88],
                 [ 2.23,  4.86,  5.12,  2.81],
                 [ 4.48,  1.38,  2.14,  0.86],
                 [ 6.68,  1.72,  8.56,  3.23]])


def plotCollection(ax, xs, ys, *args, **kwargs):

  ax.plot(xs,ys, *args, **kwargs)

  if "label" in kwargs.keys():

    #remove duplicates
    handles, labels = pyplot.gca().get_legend_handles_labels()
    newLabels, newHandles = [], []
    for handle, label in zip(handles, labels):
      if label not in newLabels:
        newLabels.append(label)
        newHandles.append(handle)

    pyplot.legend(newHandles, newLabels)

ax = pyplot.subplot(1,1,1)  
plotCollection(ax, a[:,::2].T, a[:, 1::2].T, 'r', label='data_a')
plotCollection(ax, a[:,1::2].T, a[:, ::2].T, 'b', label='data_b')
pyplot.show()

An easier (and IMO clearer) way to remove duplicates (than what you have) from the handles and labels of the legend is this:

handles, labels = pyplot.gca().get_legend_handles_labels()
newLabels, newHandles = [], []
for handle, label in zip(handles, labels):
  if label not in newLabels:
    newLabels.append(label)
    newHandles.append(handle)
pyplot.legend(newHandles, newLabels)
Seessel answered 13/10, 2014 at 11:37 Comment(3)
If you use a set for newLabels you'll avoid iterating over the entire thing when checking for membership.Majoriemajority
@Majoriemajority set doesn't preserve the elements in the order in which they were added, so your labels could appear in the wrong order in the legend. Also, when dealing with so few elements, it's not necessarily faster to use a set. Also, I think it's unnecessary to optimise plotting code :DRam
@Majoriemajority the point of using set is not to optimize it, it's to prevent the legend entries being duplicated. if you want to preserve order, then just use an ordered set.Seessel
S
17

Numpy solution based on will's response above.

import numpy as np
import matplotlib.pylab as plt
a = np.array([[3.57, 1.76, 7.42, 6.52],
              [1.57, 1.20, 3.02, 6.88],
              [2.23, 4.86, 5.12, 2.81],
              [4.48, 1.38, 2.14, 0.86],
              [6.68, 1.72, 8.56, 3.23]])

plt.plot(a[:,::2].T, a[:, 1::2].T, 'r', label='data_a')
handles, labels = plt.gca().get_legend_handles_labels()

Assuming that equal labels have equal handles, get unique labels and their respective indices, which correspond to handle indices.

labels, ids = np.unique(labels, return_index=True)
handles = [handles[i] for i in ids]
plt.legend(handles, labels, loc='best')
plt.show()
Spindrift answered 23/3, 2016 at 21:31 Comment(1)
another very short solution: legs = ax.get_legend_handles_labels(); list(zip(*[[legs[0][i], legs[1][i]] for i in [legs[1].index(l) for l in set(legs[1])]]))Telespectroscope
R
15

Matplotlib gives you a nice interface to collections of lines, LineCollection. The code is straight forward

import numpy
import matplotlib.pyplot as plt
from matplotlib.collections import LineCollection

a = numpy.array([[ 3.57,  1.76,  7.42,  6.52],
                 [ 1.57,  1.2 ,  3.02,  6.88],
                 [ 2.23,  4.86,  5.12,  2.81],
                 [ 4.48,  1.38,  2.14,  0.86],
                 [ 6.68,  1.72,  8.56,  3.23]])

xs = a[:,::2]
ys = a[:, 1::2]
lines = LineCollection([list(zip(x,y)) for x,y in zip(xs, ys)], label='data_a')
f, ax = plt.subplots(1, 1)
ax.add_collection(lines)
ax.legend()
ax.set_xlim([xs.min(), xs.max()]) # have to set manually
ax.set_ylim([ys.min(), ys.max()])
plt.show()

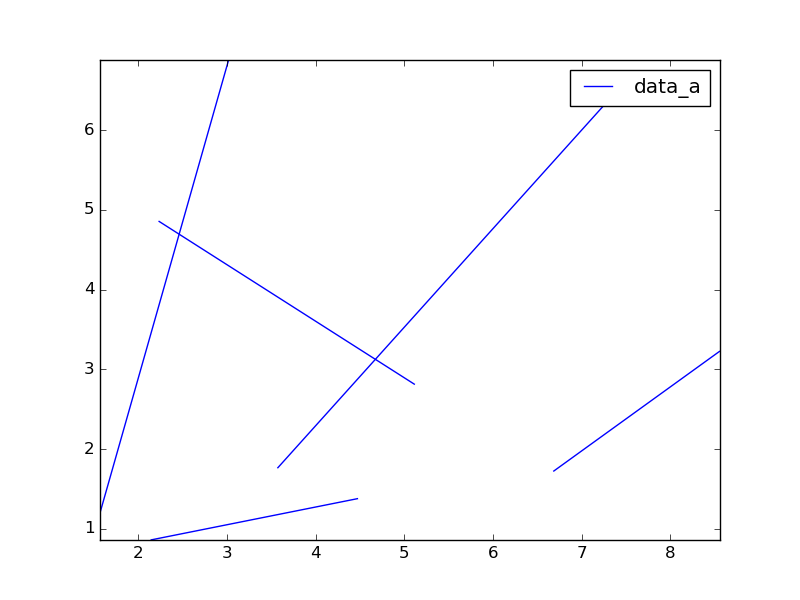
This results in the output below: A plot of the lines collected under a single legend entry.

Reynold answered 3/11, 2015 at 16:6 Comment(0)
G
10

A low tech solution is to make two plot calls. One that plots your data and a second one that plots nothing but carries the handle:

a = np.array([[ 3.57,  1.76,  7.42,  6.52],
              [ 1.57,  1.2 ,  3.02,  6.88],
              [ 2.23,  4.86,  5.12,  2.81],
              [ 4.48,  1.38,  2.14,  0.86],
              [ 6.68,  1.72,  8.56,  3.23]])

plt.plot(a[:,::2].T, a[:, 1::2].T, 'r')
plt.plot([],[], 'r', label='data_a')

plt.legend(loc='best')

Here's the result:

result

Gargan answered 5/2, 2018 at 7:34 Comment(1)
other solutions clear up a mess, this one doesnt make one in the beginning, i like itEmanuelemanuela
S
9

So using will's suggestion and another question here, I am leaving my remedy here

handles, labels = plt.gca().get_legend_handles_labels()
i =1
while i<len(labels):
    if labels[i] in labels[:i]:
        del(labels[i])
        del(handles[i])
    else:
        i +=1

plt.legend(handles, labels)

And the new plot looks like, modified multiple line plot legend

Slifka answered 13/10, 2014 at 11:0 Comment(0)
M
6

The easiest and most pythonic way to remove duplicates is to use the keys of a dict which are guaranteed to be unique. This also ensures that we only iterate over each of the (handle, label) pairs once.

handles, labels = plt.gca().get_legend_handles_labels()

# labels will be the keys of the dict, handles will be values
temp = {k:v for k,v in zip(labels, handles)}

plt.legend(temp.values(), temp.keys(), loc='best')
Majoriemajority answered 17/3, 2021 at 7:6 Comment(1)
100% this should be the answer. Simple, pythonic, and generates the desired result.Ogdon
U
3

I would do this trick:

for i in range(len(a)):
  plt.plot(a[i,::2].T, a[i, 1::2].T, 'r', label='data_a' if i==0 else None)
Unhappy answered 4/3, 2020 at 15:29 Comment(2)
This did not work when I tried it. Throws No handles with labels found to put in legend. when calling plt.legend()Hawks
The complete code is: import numpy as np import matplotlib.pyplot as plt a = np.array([[ 3.57, 1.76, 7.42, 6.52], [ 1.57, 1.2 , 3.02, 6.88], [ 2.23, 4.86, 5.12, 2.81], [ 4.48, 1.38, 2.14, 0.86], [ 6.68, 1.72, 8.56, 3.23]]) for i in range(len(a)): plt.plot(a[i,::2].T, a[i, 1::2].T, 'r', label='data_a' if i==0 else None) plt.legend(loc='best') plt.savefig('test_plot_legend.png')Unhappy
F
1

I found short way to solve this:

a = np.array([[ 3.57,  1.76,  7.42,  6.52],
              [ 1.57,  1.2 ,  3.02,  6.88],
              [ 2.23,  4.86,  5.12,  2.81],
              [ 4.48,  1.38,  2.14,  0.86],
              [ 6.68,  1.72,  8.56,  3.23]])

p1=plt.plot(a[:,::2].T, a[:, 1::2].T, color='r')
plt.legend([p1[0]],['data_a'],loc='best')
Ferdinand answered 23/6, 2021 at 22:56 Comment(0)
N
0

If 'None' is provided as label, no label is printed. So just do this:

a = np.array([[ 3.57,  1.76,  7.42,  6.52],
              [ 1.57,  1.2 ,  3.02,  6.88],
              [ 2.23,  4.86,  5.12,  2.81],
              [ 4.48,  1.38,  2.14,  0.86],
              [ 6.68,  1.72,  8.56,  3.23]])

plt.plot(a[:,::2].T, a[:, 1::2].T, 'r', label=['data_a', None, None, None, None])

plt.legend(loc='best')

Plot From The Code Above

A more lazy alternative:

a = np.array([[ 3.57,  1.76,  7.42,  6.52],
              [ 1.57,  1.2 ,  3.02,  6.88],
              [ 2.23,  4.86,  5.12,  2.81],
              [ 4.48,  1.38,  2.14,  0.86],
              [ 6.68,  1.72,  8.56,  3.23]])

n_labels = 5
labels = [None for _ in range(n_labels)]
labels[0] = 'data_a'
plt.plot(a[:,::2].T, a[:, 1::2].T, 'r', label=labels)

plt.legend(loc='best')
Neurophysiology answered 12/7, 2023 at 8:12 Comment(0)
S
0

Using a proxy artist is simple.

import matplotlib.pyplot as plt
from matplotlib.lines import Line2D
import numpy as np

a = np.array([[ 3.57,  1.76,  7.42,  6.52],
              [ 1.57,  1.2 ,  3.02,  6.88],
              [ 2.23,  4.86,  5.12,  2.81],
              [ 4.48,  1.38,  2.14,  0.86],
              [ 6.68,  1.72,  8.56,  3.23]])

# remove label in plot()
plt.plot(a[:,::2].T, a[:, 1::2].T, 'r')

# create a new legend 
legend_elements = [Line2D([0], [0], color='r', label='data_a')]

plt.legend(handles=legend_elements, loc='lower right')

enter image description here

Starstarboard answered 9/11, 2023 at 23:40 Comment(0)

© 2022 - 2024 — McMap. All rights reserved.