Plot coordinates on map
Asked Answered
H

4

37

I am trying to plot my coordinates using R. I have tried already to follow different post (R: Plot grouped coordinates on world map ; Plotting coordinates of multiple points at google map in R) but I am not having much success with my data.

I am trying to achieve a flat map of the world with my gps coordinate as colored dots (each area a specific color):

area         lat    long
Agullhas    -38,31  40,96
Polar       -57,59  76,51
Tasmanian   -39,47  108,93

library(RgoogleMaps)
lat <- c(-38.31, -35.50) #define our map's ylim
lon <- c(40.96,37.50) #define our map's xlim
center = c(mean(lat), mean(lon))  #tell what point to center on
zoom <- 2 #zoom: 1 = furthest out (entire globe), larger numbers = closer in
terrmap <- GetMap(center=center, zoom=zoom, maptype= "satallite", destfile = "satallite.png")

problem that now I don't know how to add my points and I will like one color for each region.

Could anyone help me going forward with it?

the other option I have tried is :

library(maps)
library(mapdata)
library(maptools)
map(database= "world", ylim=c(-38.31, -35.5), xlim=c(40.96, 37.5), col="grey80", fill=TRUE, projection="gilbert", orientation= c(90,0,225))
lon <- c(-38.31, -35.5)  #fake longitude vector
lat <- c(40.96, 37.5)  #fake latitude vector
coord <- mapproject(lon, lat, proj="gilbert", orientation=c(90, 0, 225))  #convert points to projected lat/long
points(coord, pch=20, cex=1.2, col="red")  #plot converted points

but the coordinates ends in a wrong position and I am not sure why

Hope someone can help

Herpes answered 17/4, 2014 at 10:24 Comment(3)
getting this error so the points don't show in map Map from URL : maps.googleapis.com/maps/api/… Google Maps API Terms of Service : developers.google.com/maps/terms " am I missing something?Herpes
today is working :) the only problem now is that if I modify the zoom to fit all the points in the same plot using a zoom of 2 the satellite map disappear and I see only a grey plot with lat and long. mapgilbert <- get_map(location = c(lon = mean(df$lon), lat = mean(df$lat)), zoom = 2, maptype = "satellite", scale = 2)Herpes
I don't know why, bor some reason you can't use zoom levels 1 & 2. Maybe this question & answers give you a possible solution.Holcombe
H
55

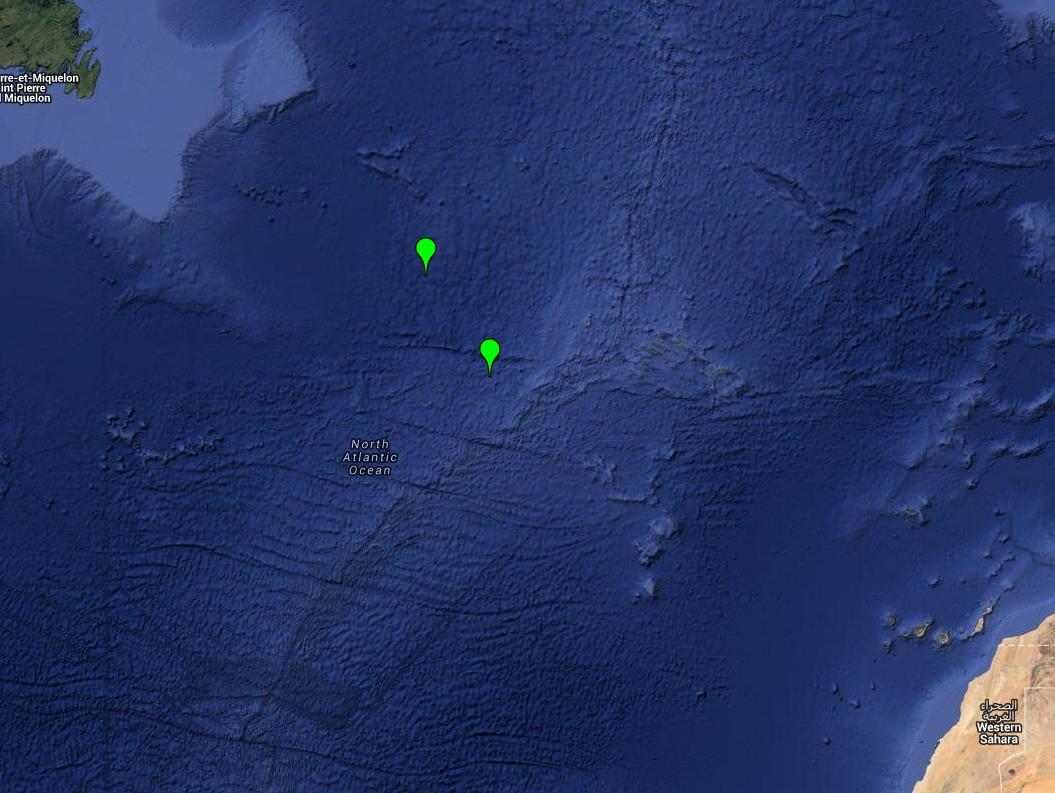
As an alternative to RgoogleMaps, you can also use the combination ggplot2 with ggmap.

With this code:

# loading the required packages
library(ggplot2)
library(ggmap)

# creating a sample data.frame with your lat/lon points
lon <- c(-38.31,-35.5)
lat <- c(40.96, 37.5)
df <- as.data.frame(cbind(lon,lat))

# getting the map
mapgilbert <- get_map(location = c(lon = mean(df$lon), lat = mean(df$lat)), zoom = 4,
                      maptype = "satellite", scale = 2)

# plotting the map with some points on it
ggmap(mapgilbert) +
  geom_point(data = df, aes(x = lon, y = lat, fill = "red", alpha = 0.8), size = 5, shape = 21) +
  guides(fill=FALSE, alpha=FALSE, size=FALSE)

you get this result: enter image description here

Holcombe answered 17/4, 2014 at 21:9 Comment(9)
I am not sure if is a problem with my R version I am keep getting this error: Error in download.file(url, destfile = destfile, quiet = !messaging, mode = "wb") : impossible open URL 'maps.googleapis.com/maps/api/…' Also: Warning message: In download.file(url, destfile = destfile, quiet = !messaging, mode = "wb") : impossible to open: status HTTP '403 Forbidden' can you tell me what is wrong??? I am using the same commands...Herpes
Maybe you could include the result of sessionInfo() in your post? I'm using R 3.0.2 (and RStudio) with ggplot2 0.9.3.1 and ggmap 2.3Holcombe
R version 2.15.3 (2013-03-01) Platform: x86_64-apple-darwin9.8.0/x86_64 (64-bit)Herpes
It gives me a url just fine, unfortunately I have to cut/paste that into a browser manually to see the map. That url is missing the dots and the labels on the outsideHazelhazelnut
@Hazelhazelnut the code is running fine for me, what did you try?Holcombe
@Holcombe Sorry my mistake. When sourcing, I forgot to use a print statement.Hazelhazelnut
@Holcombe looks great! Unfortunately no longer works with ggmap 2.6 (Error: GeomRasterAnn was built with an incompatible version of ggproto. Please reinstall the package that provides this extension.)Laryngology
@Laryngology When I run the code in my answer with ggplot2 2.2.1 and ggmap 2.6.1 it runs fine & gives me the same plot. Maybe something else is going on?Holcombe
Google Map Requires API KeyEberto
Q
14

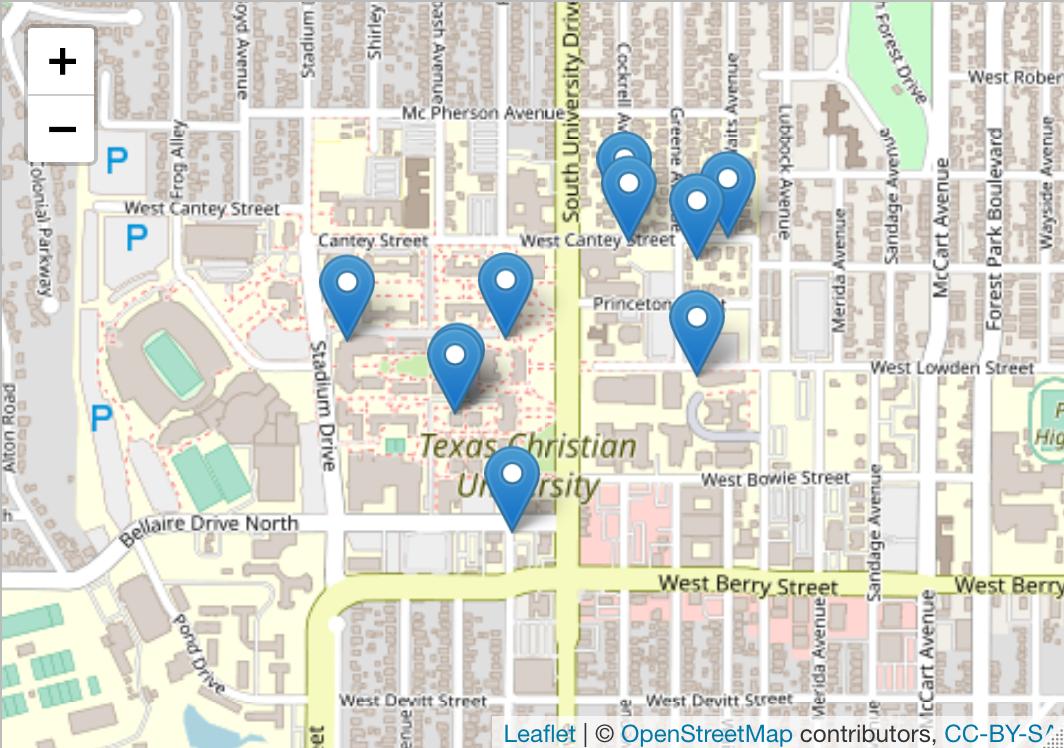
Another option is using the leaflet package (as suggested here). Unlike Google Maps it does not require any API key.

install.packages(c("leaflet", "sp"))
library(sp)
library(leaflet)
df <- data.frame(longitude = runif(10, -97.365268, -97.356546), 
                 latitude = runif(10, 32.706071, 32.712210))

coordinates(df) <- ~longitude+latitude
leaflet(df) %>% addMarkers() %>% addTiles()

Plot 10 random points in vicinity of TCU

Quarterage answered 23/2, 2019 at 19:2 Comment(2)
How would you add a variable to the marker? i.e. size of marker related to population.Beggs
Instead of addMarkers() use addCircleMarkers(radius = population) as described in the manualQuarterage
M
4

An other alternative, is the plotGoogleMaps package which allows to plot in a navigator, allowing to zoom in and out etc. You can then make a screenshot of your picture to save it (though remember google maps are legally supposed to be used for the internet).

 library("plotGoogleMaps")
 lat <- c(-38.31, -35.50) #define our map's ylim
 lon <- c(40.96,37.50) #define our map's xlim

 # make your coordinates a data frame 
 coords <- as.data.frame(cbind(lon=lon,lat=lat))

 # make it a spatial object by defining its coordinates in a reference system
 coordinates(coords) <- ~lat+lon 

 # you also need a reference system, the following should be a fine default
 proj4string(coords) <- CRS("+init=epsg:4326")
 # Note: it is a short for: 
 CRS("+init=epsg:4326")
 > CRS arguments:
 >  +init=epsg:4326 +proj=longlat +datum=WGS84 +no_defs +ellps=WGS84 +towgs84=0,0,0 

 # then just plot
 a <- plotGoogleMaps(coords)
 # here `a <-` avoids that you get flooded by the html version of what you plot 

And you get : enter image description here

Milfordmilhaud answered 3/11, 2015 at 9:18 Comment(1)
coordinates(coords) <- ~lat+lon should be coordinates(coords) <- ~lon+latMatherne
D
1

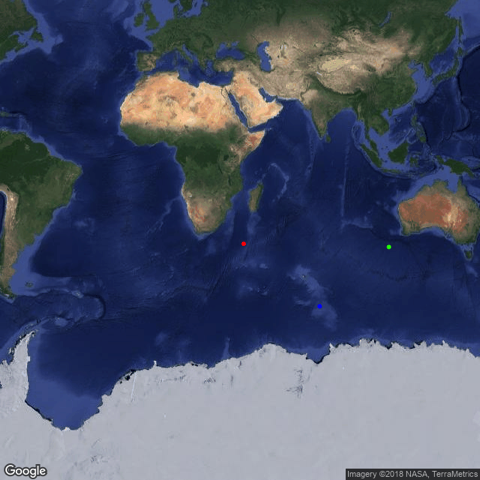
Here is a solution using only Rgooglemaps, as requested by the user.

# get map (from askers OP, except changed map type = "Satallite" to type = "Satellite")
library(RgoogleMaps)
lat <- c(-38.31, -35.50) #define our map's ylim
lon <- c(40.96,37.50) #define our map's xlim
center = c(mean(lat), mean(lon))  #tell what point to center on
zoom <- 2 #zoom: 1 = furthest out (entire globe), larger numbers = closer in
terrmap <- GetMap(center=center, zoom=zoom, type= "satellite", destfile = "satellite.png")

# plot points and save image
lat <- c(-38.31, -57.59, -39.47)
lon <- c(40.96, 76.51, 108.93)
png('map.png')
PlotOnStaticMap(terrmap, lat = lat, lon = lon, pch = 20, col = c('red', 'blue', 'green'))
dev.off()

enter image description here

Determinable answered 1/3, 2018 at 22:19 Comment(0)

© 2022 - 2024 — McMap. All rights reserved.