savefig without frames, axes, only content
Asked Answered
S

13

118

In numpy/scipy I have an image stored in an array. I can display it, I want to save it using savefig without any borders, axes, labels, titles,... Just pure image, nothing else.

I want to avoid packages like PyPNG or scipy.misc.imsave, they are sometimes problematic (they do not always install well, only basic savefig() for me

Salk answered 21/11, 2011 at 21:13 Comment(0)
D
145

EDIT

Changed aspect='normal to aspect='auto' since that changed in more recent versions of matplotlib (thanks to @Luke19).


Assuming :

import matplotlib.pyplot as plt

To make a figure without the frame :

fig = plt.figure(frameon=False)
fig.set_size_inches(w,h)

To make the content fill the whole figure

ax = plt.Axes(fig, [0., 0., 1., 1.])
ax.set_axis_off()
fig.add_axes(ax)

Then draw your image on it :

ax.imshow(your_image, aspect='auto')
fig.savefig(fname, dpi)

The aspect parameter changes the pixel size to make sure they fill the figure size specified in fig.set_size_inches(…). To get a feel of how to play with this sort of things, read through matplotlib's documentation, particularly on the subject of Axes, Axis and Artist.

Downpipe answered 21/11, 2011 at 21:38 Comment(9)
nope, I still have some small transparent border, and what I want is no border at all, pure imageSalk
Maybe, it's because I forgot about the case where the image is not square :P. Just edited to add the aspect param. How's it now?Downpipe
grrr, no, still the same. There is a small, transparent border around the image, few pixels on each sideSalk
almost! I figured out that the border was added by bbox_inches='tight'. But, now the images instead of desired 24x24px are 800x600px. Still looking...Salk
If you manually set the w and h parameters in fig.set_size_inches(w,h) and the dpi parameter in fig.savefig(fname, dpi) so that it result in 24px by 24px, it should work just fine. For example, w = h = 1 and dpi = 24Downpipe
I had to combine both this answer, and the answer below by Mostafa Pakparvar. Not only do you need to turn off the axes, but you need to set_visible to false to make sure the white space disappears. (wtf?)Glassman
Just tried this using matplotlib v2.2.2 an it worked perfectly (except that imshow's syntax changed to aspect='auto' instead of 'normal').Yetah
This is the right approach. ax = plt.Axes(fig, [0., 0., 1., 1.]) is what makes it work.Sharpfreeze
I had to change the last line to fig.savefig(fname, dpi=dpi).Fortran
N
113

An easier solution seems to be:

import matplotlib.pyplot as plt

    plt.imshow(img)
    plt.axis('off')
    fig.savefig('out.png', bbox_inches='tight', pad_inches=0)
Necolenecro answered 4/12, 2012 at 16:51 Comment(8)
This worked out great for me. Also, pad_inches can be changed to desired size easily. Thanks!Candlemas
+1 worked out great for me too :) And this is actually way simpler than the accepted answerIraqi
I still got white margins with this.Almswoman
Yes, for newer versions of Matplotlib the above line seemingly results in small margins. Setting the extent manually is probably the cleanest solution: fig.set_size_inches((width, height)) extent = mpl.transforms.Bbox(((0, 0), (width, height))) fig.savefig([...], bbox_inches=extent)Necolenecro
I was able to update this for newer versions/remaining margins issue simply by adding transparent=True fig.savefig('out.png', bbox_inches='tight',transparent=True, pad_inches=0)Helium
Still got axes and tickmarks and everything with this :(Scintillation
This does not do anything at all. It will give you the figure with all axes and labels.Campos
I recommend borrowing plt.axis('off') from another answer in combination with this one.Fullblooded
P
33

You can find the bbox of the image inside the axis (using get_window_extent), and use the bbox_inches parameter to save only that portion of the image:

import numpy as np
import matplotlib.pyplot as plt

data=np.arange(9).reshape((3,3))
fig=plt.figure()
ax=fig.add_subplot(1,1,1)
plt.axis('off')
plt.imshow(data)

extent = ax.get_window_extent().transformed(fig.dpi_scale_trans.inverted())
plt.savefig('/tmp/test.png', bbox_inches=extent)

I learned this trick from Joe Kington here.

Perceptual answered 21/11, 2011 at 22:6 Comment(3)
just plt.axis('off') helped. Other answers don't much help.Commonly
This worked pretty well. However in my case there is still a small white border. Any ideas of how to remove this border?Planchet
@user3731622, please try plt.savefig('/temp/test.png', bbox_inches='tight', transparent=True, pad_inches=0) instead of plt.savefig('/tmp/test.png', bbox_inches=extent)Vasilikivasilis
S
23

I've tried several options in my case, and the best solution was this:

fig.subplots_adjust(bottom = 0)
fig.subplots_adjust(top = 1)
fig.subplots_adjust(right = 1)
fig.subplots_adjust(left = 0)

then save your figure with savefig

Subphylum answered 12/8, 2015 at 0:15 Comment(1)
Out of all of this solutions, this is the only one that worked for me.Cordula
B
10

Actually I have tried this recently and instead of all these lines, you can use

plt.imsave(image_path, image)

Works like a charm. just one line and problem solved.

imsave()

Documentation ( https://matplotlib.org/3.1.1/api/_as_gen/matplotlib.pyplot.imsave.html )

Benner answered 28/4, 2020 at 20:58 Comment(3)
This works like a charm! It should be the best answer.Leeth
The only problem with this approach is that, you can't use annotations and save it correctly in the image.Furrier
@NicolásMedina please check the question again, it is about saving only content, just image, and nothing else. Its not about saving annotations or other image data.Benner
C
9

I will suggest heron13 answer with a slight addition borrowed from here to remove the padding left after setting the bbox to tight mode, therefore:

axes = fig.axes()
axes.get_xaxis().set_visible(False)
axes.get_yaxis().set_visible(False)
fig.savefig('out.png', bbox_inches='tight', pad_inches=0)
Crawly answered 15/9, 2015 at 8:54 Comment(4)
I am getting an error saying get_xaxis() and get_yaxis() don't exist. Any idea why that would happen?Moreville
Make an axes() object, then use ax.xaxis and ax.yaxisPearlpearla
Got an error saying 'list' object has no attribute 'get_xaxis'Kandace
@HaozheXie Use an Axes object, not a list of Axes...Maverick
C
9

For anybody trying to do this in Jupyter Notebook

 plt.axis('off')

 spec = plt.imshow

 plt.savefig('spec',bbox_inches='tight',transparent=True, pad_inches=0)
Covenantor answered 14/6, 2019 at 1:47 Comment(0)
R
8

This one work for me

plt.savefig('filename',bbox_inches='tight',transparent=True, pad_inches=0)
Recycle answered 10/4, 2018 at 3:55 Comment(0)
V
4

For me, this code made similar the input image size without frame and axes. I combined snippets from matehat, unutbu, and WHZW:

fig = plt.figure()
ax = fig.add_subplot(1,1,1)
plt.axis('off')
viridis = cm.get_cmap('gist_gray', 256)
plt.imshow(data, aspect='auto', cmap=viridis)
plt.tight_layout()
plt.savefig(out_file, bbox_inches='tight', transparent=True, pad_inches=0)

Runtime environment:
  Python: 3.6.10
  Matplotlib: 3.2.1
  OS: Windows 10

Vasilikivasilis answered 19/5, 2020 at 4:14 Comment(0)
G
3

I had the same problem while doing some visualization using librosa where I wanted to extract content of the plot without any other information. So this my approach. unutbu answer also helps me to make to work.

    figure = plt.figure(figsize=(500, 600), dpi=1)
    axis = plt.subplot(1, 1, 1)
    plt.axis('off')
    plt.tick_params(axis='both', left='off', top='off', right='off', bottom='off', labelleft='off', labeltop='off',
                    labelright='off', labelbottom='off')

     # your code goes here. e.g: I used librosa function to draw a image
    result = np.array(clip.feature_list['fft'].get_logamplitude()[0:2])
    librosa.display.specshow(result, sr=api.Clip.RATE, x_axis='time', y_axis='mel', cmap='RdBu_r')


    extent = axis.get_window_extent().transformed(figure.dpi_scale_trans.inverted())
    plt.savefig((clip.filename + str("_.jpg")), format='jpg', bbox_inches=extent, pad_inches=0)
    plt.close()
Guthry answered 22/3, 2017 at 2:23 Comment(2)
This got me on the right track, but I had two problems: 1) I had to set the dpi to a number greater than 1 to avoid a font error in my jupyter notebook; and 2) there was still a small border so I have to manually change the extent Bbox to extent.get_points()*np.array([[1.1],[.9]]).Crispa
thanks for the fulfiling the answer which may help to somebody else.Guthry
J
2

While the above answers address removing margins and padding, they did not work for me in removing labels. Here's what worked, for anyone who stumbles upon this question later:

Assuming you want a 2x2 grid of subplots from four images stored in images:

matplotlib.pyplot.figure(figsize = (16,12)) # or whatever image size you require
for i in range(4):
    ax = matplotlib.pyplot.subplot(2,2,i+1)
    ax.axis('off')
    imshow(images[i])
matplotlib.pyplot.savefig(path, bbox_inches='tight')
Joannajoanne answered 29/4, 2018 at 7:44 Comment(0)
A
1

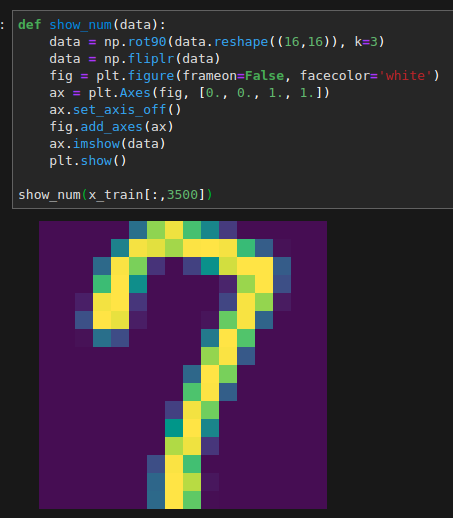
I tried to get rid of the border too, using tips here but nothing really worked. Some fiddling about and I found that changing the faceolor gave me no border in jupyter labs (Any color resulted in getting rid of the white border). Hope this helps.

def show_num(data):
data = np.rot90(data.reshape((16,16)), k=3)
data = np.fliplr(data)
fig = plt.figure(frameon=False, facecolor='white')
ax = plt.Axes(fig, [0., 0., 1., 1.])
ax.set_axis_off()
fig.add_axes(ax)
ax.imshow(data)
plt.show()

enter image description here

Agribusiness answered 7/7, 2019 at 12:15 Comment(0)
R
0

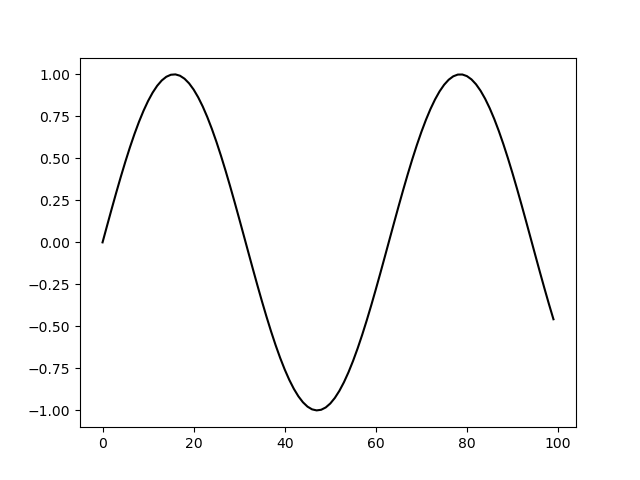
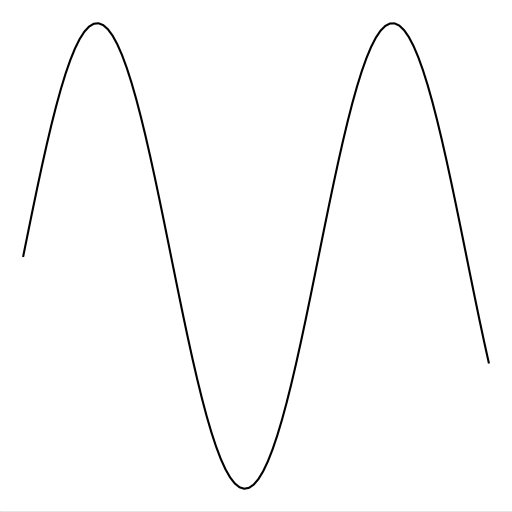
I am working on a CNN model which needs simulated images as input training data. Thus, I need axes to be removed completely. I tried all presented answers and found below combination the most effective in my case for outputting a certain size figure by pixels (in my case 512*512). As an example:

import numpy as np
import matplotlib.pyplot as plt

time = np.arange(0, 10, 0.1)
amplitude = np.sin(time)

plt.plot(amplitude, c = 'black')

plt.savefig('no_content_data.png')
plt.close()

which saves below figure in a normal way with axes and no specific size: enter image description here

While below codes remove everything and output figure in 512*512 pixel size:

pixels = 512
px = 1/plt.rcParams['figure.dpi']  # pixel in inches
fig, ax = plt.subplots(frameon=False)
fig.set_size_inches(pixels*px, pixels*px)
ax = plt.Axes(fig, [0., 0., 1., 1.]) # This is needed for fitting content to 512*512 figure frame otherwise output figure will be less than desired size
ax.set_axis_off()
fig.add_axes(ax)

plt.plot(amplitude, c = 'black')

fig.subplots_adjust(bottom = 0)
fig.subplots_adjust(top = 0.00001) # This value should be very small so that marginal axes of subplot would not overlay on the main figure
fig.subplots_adjust(right = 1)
fig.subplots_adjust(left = 0)

plt.savefig('no_content_data.png')
plt.close()

which gives this: enter image description here

Rutland answered 18/5, 2023 at 0:18 Comment(0)

© 2022 - 2024 — McMap. All rights reserved.