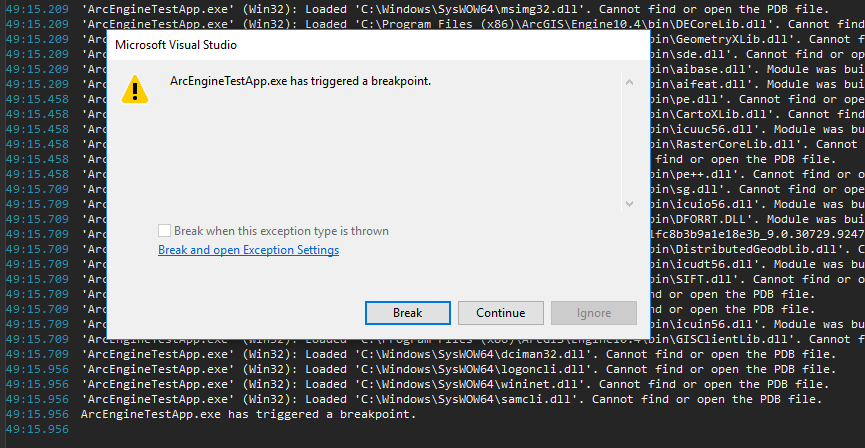
We have a C++ project in STA mode which opens an C#/WPF lib that hosts an ESRI ArcEngine MapControl via WindowsFormsIntegration. This worked fine in Visual Studio 2013. Since we switched to VS2015 Update 3 starting the ArcEngine part while debugging (both in Debug and Release) is horribly slow after an mysterious breakpoint is hit in wntdll.pdb: "ArcEngineTestApp.exe has triggered a breakpoint."
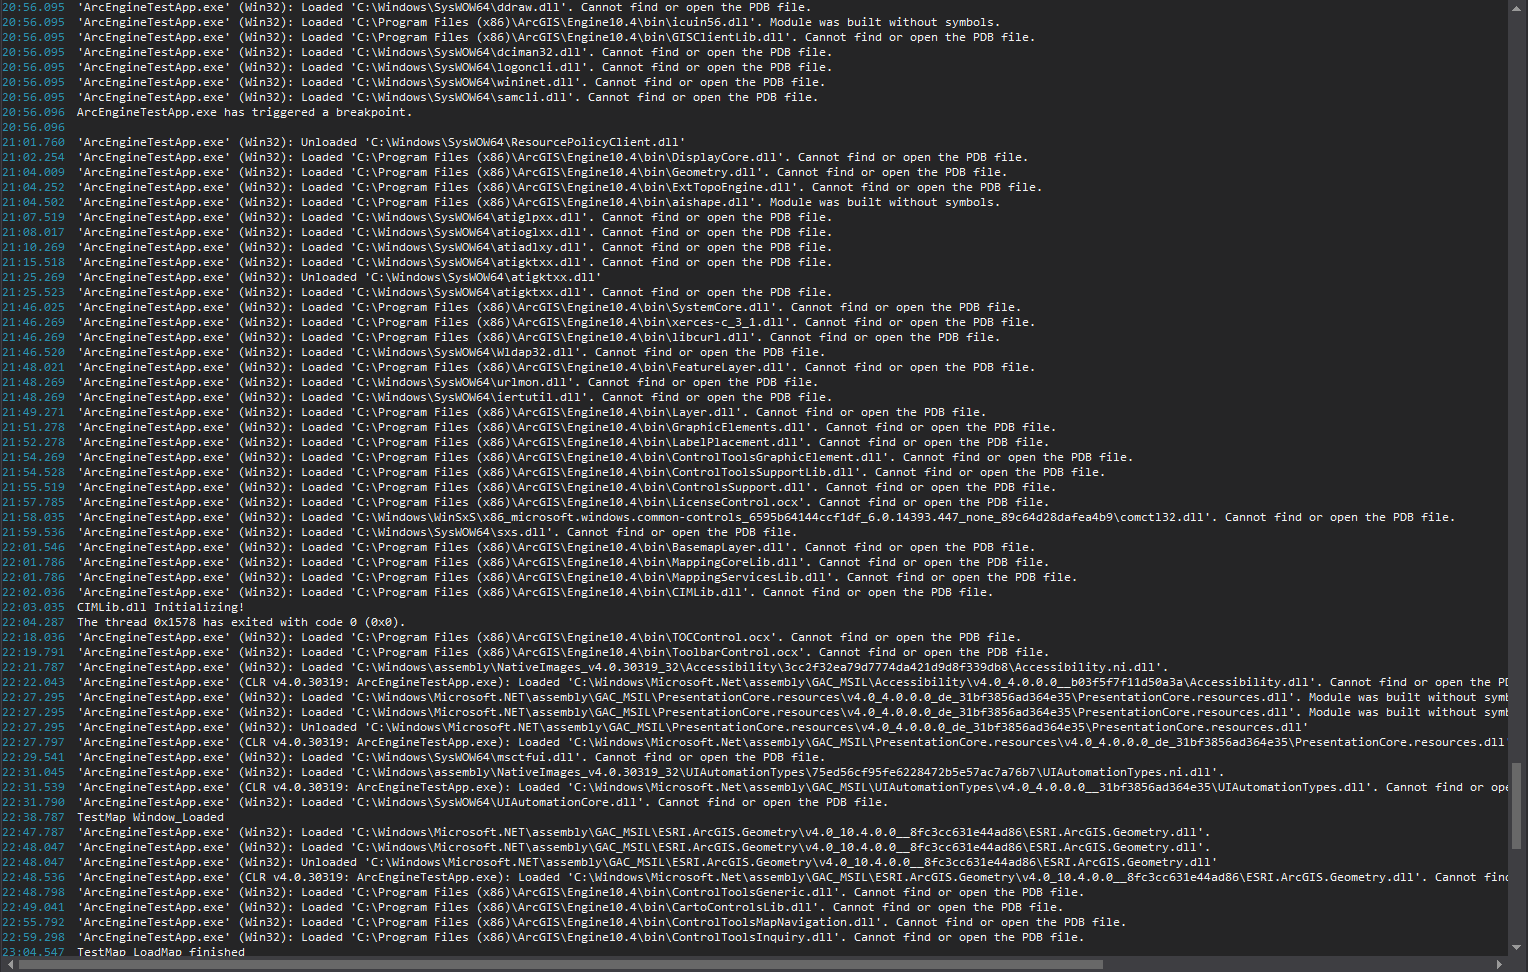
There is no further explaination in the Output window (see full output). When I hit continue, the app continues loading symbols, but at least from now on it's definitly slower than in Visual Studio 2013. It takes VS 2015 15s to reach the breakpoint and 2:15m to complete the loading afterwards. VS 2013 shows the ArcEngine in 15-20s. See this screenshot for comparision (unfortunatly one can't copy the timestamp)

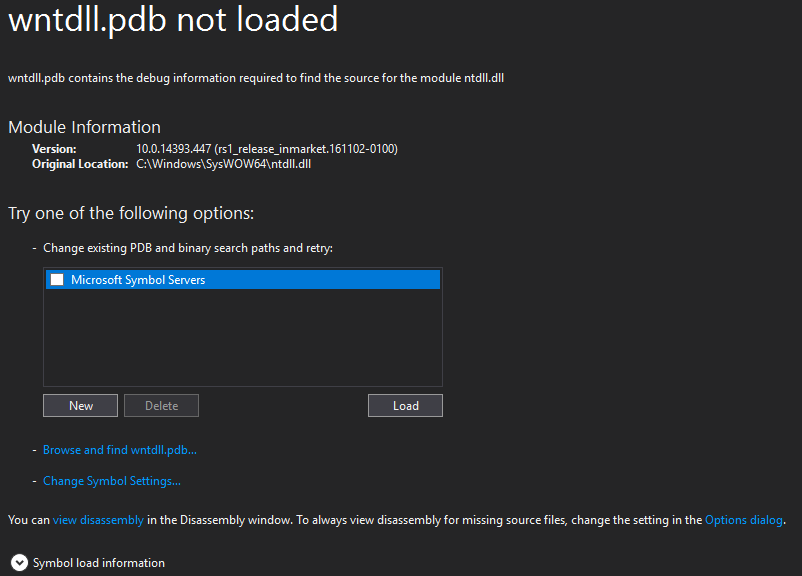
When I hit break on the message, "wntdll.pdb not loaded" is shown:
Loading the pdb from the Microsoft server fails.
To demonstrate this we made a demo project (see below for details).
This only occurs while debugging. The compiled app works fine and fast.
What we have tried yet without success:
- searched for the "has triggered a breakpoint" message without finding a similar issue.
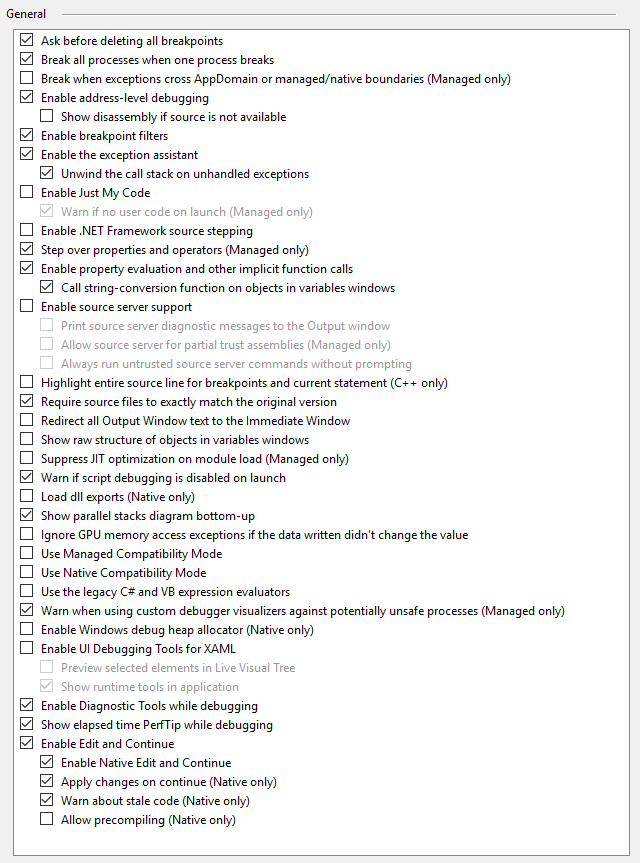
- Deactivated settings known for performance problems (UI Debugging Tools for XAML, Diagnostics Tools, IntelliTrace)
- In Debugging / Symbols is no symbol server activated
- There are no VS extensions installed that are known to have an impact on performance. (See below for full list)
- Tried different ArcEngine versions (10.3.1 and 10.4)
- Load the symbols from both MS and ESRI symbol server and cache them locally.
- Delete all breakpoints
- I completly reinstalled my PC. Now only one Visual Studio is installed (2015)
- Tested on another PC (several VS installed) - same behavior
List of installed extensions:
- ArcObjects SDK Integration for Desktop Addins
- ArcObjects SDK Integration Utilities
- Developer Analytics Tools
- Format document on Save
- Microsoft.NET Core Tools
- Microsoft ASP.NET and Web Tools
- Microsoft ASP.NET Web Frameworks and Tools
- Microsoft Azure App Service Tools
- Microsoft Connected Services
- NuGet Package Manager for VS 2015
- Productivity Power Tools 2015 (only timestamps in output window is activated)
- TypeScript for Microsoft Visual Studio
- Visual Studio Extensibillity Templates
VS 2015 Output (beginning with the start of the ArcEngine call).
To run the Demo project, you need a valid ArcEngine license and the ArcEngine SDK. Due to license reasons we can't publish the ESRI dlls. Copy them into the project folder "ArcEngineTestLibs".


