Offsetting a polyline in one direction
Asked Answered
A

1

5

I'm looking for a way to offset an arbitrary curve defined through xy-coordinates in one direction (in R). I can use the {polyclip} package to offset the curve in two directions.

library(polyclip)
#> polyclip 1.10-0 built from Clipper C++ version 6.4.0

# Make a curve
t <- seq(10, 0, by = -0.05)
curve <- data.frame(
  x = t * cos(t), y = t * sin(t)
)
plot(curve, type = 'l')

# Find offset
offset <- polylineoffset(curve, delta = 0.5, 
                         jointype = "round", endtype = "openbutt")[[1]]
offset <- as.data.frame(offset) # xy coordinates

lines(offset, col = "red")

Because the points on the curve are more closely spaced than the offset's delta parameter, I can heuristically split the offset by finding out where the distance between a point and the next is the largest.

distance <- c(0, sqrt(diff(offset$x)^2 + sqrt(diff(offset$y)^2)))
max_dist <- which.max(distance)

plot(curve, type = 'l')
lines(offset[1:(max_dist - 1), ], col = 3)
lines(offset[max_dist:nrow(offset), ], col = 4)

Created on 2021-11-11 by the reprex package (v2.0.1)

However, I would like to be able to split the offset, or offset in just one direction, even if the points on the curve are further apart than the offset distance. Is there a way to do this in R? I'm not married to the {polyclip} package, a solution using another package is fine too.

Accurate answered 11/11, 2021 at 22:9 Comment(0)
H
6

No need for extra packages Teunbrand - this can done with a small trig function:

offset <- function(x, y, d) {
 angle <- atan2(diff(y), diff(x)) + pi/2
 angle <- c(angle[1], angle)
 data.frame(x = d * cos(angle) + x, y = d * sin(angle) + y)
}

So, if we recreate your example we have:

t <- seq(10, 0, by = -0.05)

curve <- data.frame(
  x = t * cos(t), y = t * sin(t)
)

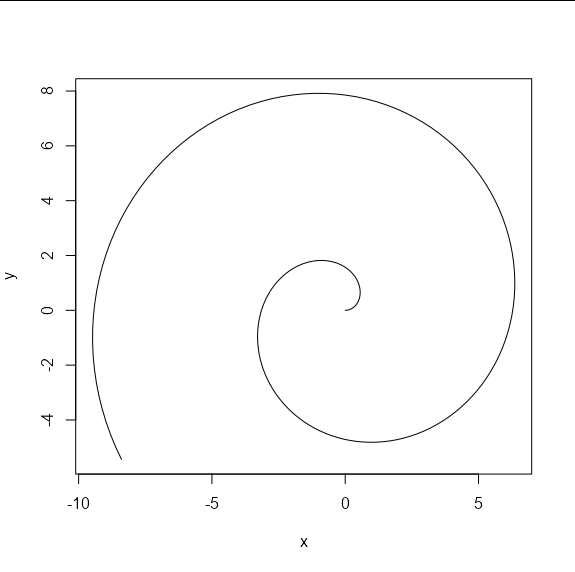
plot(curve, type = 'l')

enter image description here

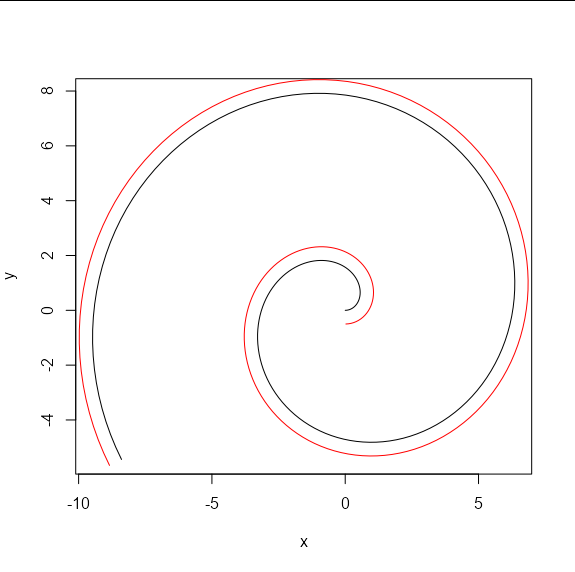
And we can add an offset with:

curve2 <- offset(curve$x, curve$y, 0.5)

lines(curve2, col = "red")

enter image description here

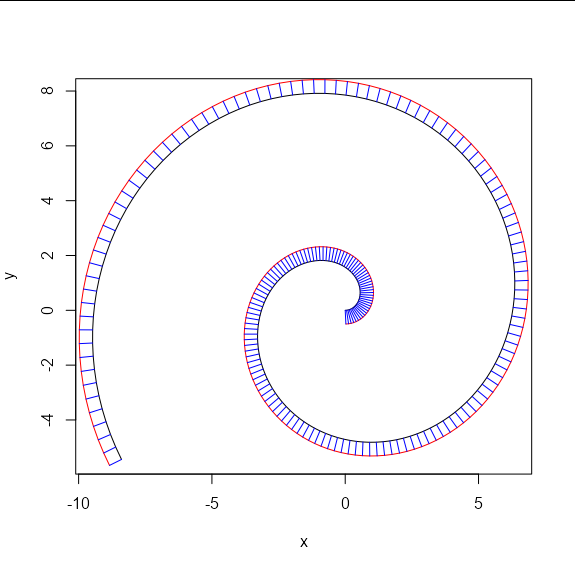
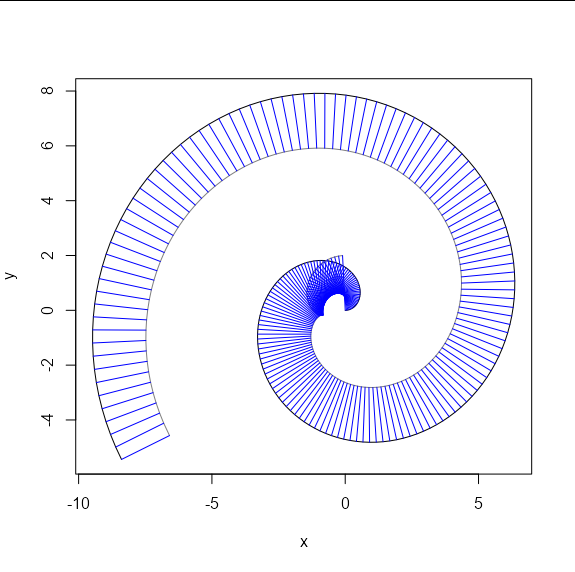
The way this function works is by getting the angle of the slope at each point of the line using atan2([delta y], [delta x]), then adding 90 degrees to find the angle of a line running perpendicular to the curve at that point. Finally, it finds the point that is distance d along this line from the original x, y co-ordinate, which is (x + d * cos(angle), y + d * sin(angle))

This is maybe best shown graphically. The blue lines here are the offsets calculated by the function offset:

segments(curve$x, curve$y, curve2$x, curve2$y, col = "blue")

enter image description here

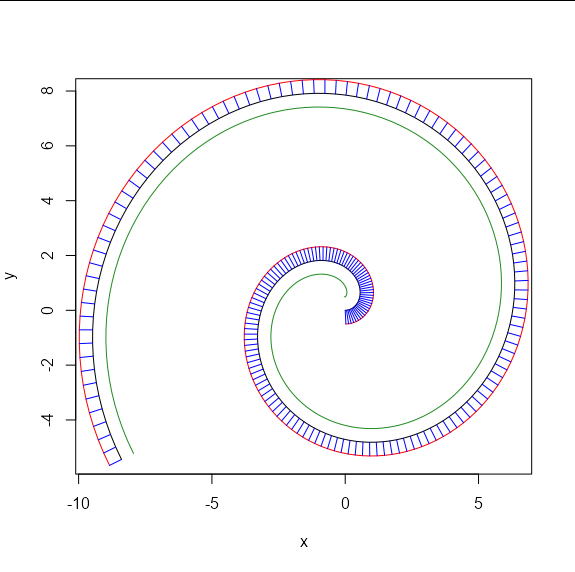
We can offset in the opposite direction by simply passing a negative value of d:

lines(offset(curve$x, curve$y, -0.5), col = "forestgreen")

enter image description here

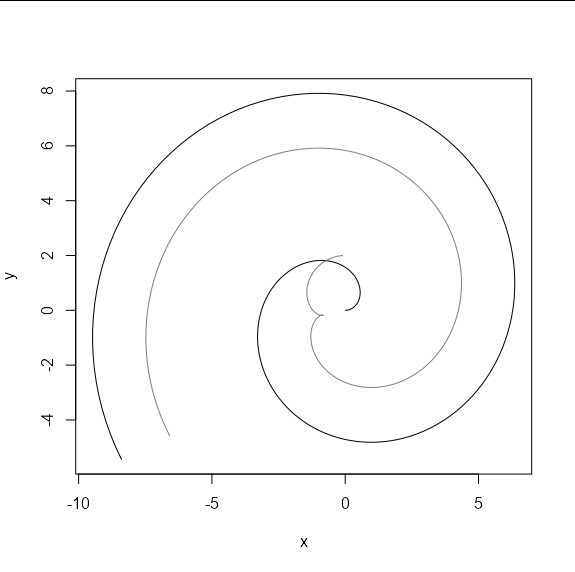
We need to be aware of the limitations of defining what we mean by an offset, particularly when the offset is large compared to any concave sections of the plot. For example, if we look at an offset of -2, we seem to have an artifact at the center of our spiral:

plot(curve, type = 'l')
curve3 <- offset(curve$x, curve$y, -2)
lines(curve3, col = "gray50")

enter image description here

We can see why this happens if we draw the offset segments again:

segments(curve$x, curve$y, curve3$x, curve3$y, col = "blue")

enter image description here

Essentially, if you have a tight concave curve and a fairly large offset, then the offset lines will cross. This produces something that doesn't quite match with what we would expect to see with an "offset path", but it is difficult to see how this could be fixed without carefully defining what we mean by an offset path, and how we would want it to appear in situations like the one above. My guess is that the most satisfactory solution would be to shrink d at the points where it would otherwise exceed the radius of the curve at that point, but I won't implement that here as this is only one option, and I'm sure there are better ones out there.

Anyway, one of the benefits of doing it this way is that the number of points in the result is the same as the number that went in. This makes it easy to have the offsets put into your initial data frame. Handy for building new geoms!

Created on 2021-11-12 by the reprex package (v2.0.0)

Hilliard answered 12/11, 2021 at 1:12 Comment(2)
Thanks Allan Cameron, very useful answer per usual! Also thanks for not only giving a function that works but also for the explanation as trigonometry is not my strongest suit (and indeed I'm experimenting with this for building geoms!).Accurate
I also found that using M <- atan2(diff(y, 2), diff(x, 2)) + pi/2; M <- c(M[1], M, M[length(M)]) does a good job for much simpler curves such as t <- seq(0, 2 * pi, length.out = 7); x = cos(t); y = sin(t) (a hexagon).Accurate

© 2022 - 2024 — McMap. All rights reserved.