Improve positioning of subscript and superscript on node labels
Asked Answered
D

5

39

When using both subscript and superscripts on a node label, is it possible to alter the positioning so that they are directly above each other.

Example:

digraph G {
        x11[label=<X<SUB>1</SUB><SUP>(1)</SUP>>];   
        x21[label=<X<SUB>2</SUB><SUP>(1)</SUP>>];
        x11 -> x21 
    }

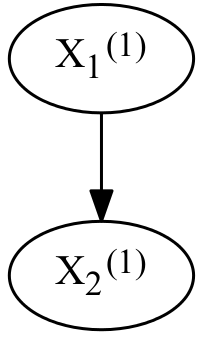
Which produces

enter image description here

Is it possible to have the (#) directly above the # rather than slightly to the right? thanks


I tried to add a custom css script (re: HTML: can I place subscript text right under the superscript?) to my dot script with stylesheet = "styles.css"; (re: Using CSS classes in HTML labels on Graphviz), however, it it returns an error

Error: Unknown HTML element <span> on line 1

Depside answered 5/9, 2016 at 16:43 Comment(0)
M
17

The native HTML-like node rendering of Graphviz is quite limited. The Graphviz docs say this clearly. I don't believe there's a way to coax it to do what you want. Even if there is a way to tweak e.g. a <table> definition to do it, the results are likely to look bad.

Therefore, I recommend you look at dot2tex. Its whole purpose is to allow the full power of LaTeX for rendering nodes. Setup isn't trivial, but results are worth it.

Here's a page showing examples of graphs containing LaTeX-set math in nodes.

You didn't say what the output should be. But there are ways to convert LaTeX to many different forms. Easiest are Postscript and PDF. But images formats are also possible.

Addition

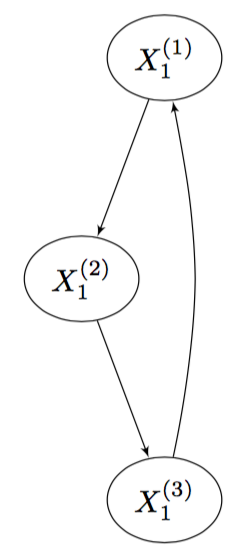
Okay I installed dot2tex, and here's a result:

GraphViz graph with stacked subscripts under superscripts

Here's the corresponding dot code:

digraph G {
  a_1 [texlbl="$X_{1}^{(1)}$"];
  a_2 [texlbl="$X_{1}^{(2)}$"];
  a_3 [texlbl="$X_{1}^{(3)}$"];
  a_1-> a_2 -> a_3 -> a_1;
}

I compiled with

$ dot2tex foo.gv -f tikz > foo.tex
$ pdflatex foo.tex

Since you're already using LaTeX, you should be able to adjust this to meet your exact requirements without much trouble.

Malnutrition answered 7/5, 2017 at 0:39 Comment(1)
Thanks again Gene, imo this gives the nicest solution. [if required, one way the numbers can be aligned is using \phantom : texlbl="$X_{\phantom{(}1}^{(2)}$" ]Depside
P
4

Per the Graphviz docs, their 'HTML-Like Labels' do not include the span element, and the font-styling tags do not allow the style attribute (or any other):

<SUB
  <!-- No attributes -->
>

<SUP
  <!-- No attributes -->
>

The two best options for precise text layout seem to be:

1) Use a label with an html-like table, which does allow for custom styling (and handles vertically placed text fine anyway).

x11[label=<
    <TABLE border="0" cellborder="0" cellspacing="0">
    <TR><TD rowspan="2" style="...">X</TD><TD style="...">(1)</TD></TR>
    <TR>                                  <TD style="...">1</TD></TR>
    </TABLE>>];

2) If using the PostScript driver, override the node generation entirely and supply a ps file that draws exactly what you want.

Parisian answered 7/5, 2017 at 0:37 Comment(2)
Thanks, this is a good workaround that keeps it all in graphviz. It centers the numbers directly under each other which is great but it does add a little extra space between the sub/superscripts and the node labels. I'll have a wee look to see if I can tweak it.Depside
Yup, tweaking the layout with the style attributes should help a bit. Using full tex as suggested below is probably more appropriate for you, but fiddling with tables might be enough for others.Parisian
S
4

Maybe we could introduce a more powerful HTML renderer (I just noticed litehtml, and sciter which is not open source) which probably has its own make system, potential security issues, its own font and color name management, shared strings, C++ compiler dependencies, memory leaks, and litehtml for instance is only 16K lines of code which these days barely moves the meter for us, just I always feel a little guilty when I see tweets about how building graphviz is harder than the linux kernel. Stephen North

Sheath answered 7/5, 2017 at 1:42 Comment(3)
One thing I expected to be possible and was surprised reading the docs wasn't, would be to use svg directly for a node when using svg/raster outputs. I guess this is because it's harder to enforce the svg doesn't leak outside an area than the equivalent with postscript?Parisian
Thank you for your comment Stephen. Yes, I think changing the graphviz source is going a bit far for a wee change in label positions!Depside
I just noticed this comment. Actually, I'm a little surprised we don't support SVG import (isn't that the point of all the expat ghostscript etc. machinery?) The docs are always very up to date. We could really use help to take a fresh look at that. I think the renderer could figure out the bounding box of the imported code, or, just trust the declared bounding box or trust the graphviz user to declare the correct node size. Philosophically that would be our general approach.Sheath
C
0

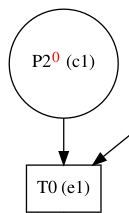
For the sake of completeness, I add a sample of an example using C to produce Graphviz code and harnessing HTML tags:

C code

for (i = 1; i <= numco; i++)
    printf("  c%d [label= <%s<FONT COLOR=\"red\"><SUP>%d</SUP></FONT>&nbsp;(c%d)> shape=circle];\n",
            i,plname[co2pl[i]],tokens[i],i);

Dot code

digraph test {
    c1 -> e1;
    c1 [label= <P2<FONT COLOR="red"><SUP>0</SUP></FONT>&nbsp;(c1)> shape=circle];
    e1 [label="T0 (e1)" shape=box];
}

Result*

enter image description here

*Please ignore the incomplete arrow, I took this sample from a bigger example.

Coastal answered 7/9, 2021 at 10:14 Comment(0)
T
0

You could create a freestanding SVG file (e.g.using Inkscape or similar) with the superscript directly over the subscript and then include that SVG file as the content of the node (https://graphviz.org/docs/attrs/image/)

Traynor answered 8/9, 2021 at 0:12 Comment(0)

© 2022 - 2024 — McMap. All rights reserved.