Scientific notation colorbar
Asked Answered
O

4

39

I am trying to put a colorbar to my image using matplotlib. The issue comes when I try to force the ticklabels to be written in scientific notation. How can I force the scientific notation (ie, 1x10^0, 2x10^0, ..., 1x10^2, and so on) in the ticks of the color bar?

Example, let's create and plot and image with its color bar:

import matplotlib as plot
import numpy as np

img = np.random.randn(300,300)
myplot = plt.imshow(img)
plt.colorbar(myplot)
plt.show()

When I do this, I get the following image:

image created with the previous code

However, I would like to see the ticklabels in scientific notation... Is there any one line command to do this? Otherwise, is there any hint out there?

Orientation answered 22/9, 2014 at 21:14 Comment(0)
D
55

You could use colorbar's format parameter:

import matplotlib.pyplot as plt
import numpy as np
import matplotlib.ticker as ticker

img = np.random.randn(300,300)
myplot = plt.imshow(img)

def fmt(x, pos):
    a, b = '{:.2e}'.format(x).split('e')
    b = int(b)
    return r'${} \times 10^{{{}}}$'.format(a, b)

plt.colorbar(myplot, format=ticker.FuncFormatter(fmt))
plt.show()

enter image description here

Divided answered 22/9, 2014 at 21:27 Comment(14)
Thanks, but I would like to see 10^1 10^2, etc rather than e+01,e+02. Is it possible?Orientation
I have modified your code a little in order to show the scientific notation using latex. Thank you very much! You solution is very useful and very interesting indeed.Orientation
Thanks for the improvement.Divided
The solution shown up here can only put one character in superscript. Therefore if your exponent is either negative or greater than 9, the other characters aren't properly formated. As LaTeX requires the curly brackets to display more than one character as superscript, this modification showed to be useful: return r'$'+str(a)+r' \times 10^{'+str(b)+r'}$'Nerti
Thanks a lot, but can you force b = 1: to have everything in 10^1. (for example)Apologue
Can you force b = 1: to have everything in 10^1. (for example) @DividedApologue
@AgapeGal'lo: Since x = a * 10**b, it follows that x = a * 10**(b-1) * 10**1. So you would modify fmt to make a a float (i.e. a = float(a),) then return r'${} \times 10^{{{}}}$'.format(a * 10**(b-1), 1).Divided
@Divided It does not work. It gives something like 1.54e -0.6 10^1. I don't get where this -0.6 come from...Apologue
@AgapeGal'lo: You can force decimal notation by using something like .10f as the format spec, which would lead to code looking like this. Another possibility is to use Joe Kington's FixedOrderFormatter, leading to code like this.Divided
@Divided thanks a lot ! It works perfectly. I would have an additional question (even if it's out of the subject): how can you fix the minimum and the maximum, and have a color bar (and a color map) which follow it ? For example -4 to 4 for your script (-4 ---> deep blue and +4 deep red).Apologue
You could use imshow(..., vmin=-4, vmax=4) to set the min and max values. The colorbar will adjust accordingly. To get (-4 ---> deep blue and +4 deep red) you could pass cmap=plt.get_cmap('jet') an a parameter to imshow as well (again see the link for an example). Note however that while the jet color map looks pretty, it is not recommended for scientific presentation because it the color scheme can mask or enhance variations when it shouldn't. That's why viridis is the new default.Divided
A gallery of colormap options can be found here.Divided
Unfortunately, I can not vote, but I agree with the second suggestion because it is simpler. Also, for more decimals, simply use: pl.colorbar(myplot, format='%.2e') or '%.3e', etc.Andro
Note1: plt.colorbar(myplot, format=None) to turn it back to normal. I had to use this for subplots that I didn't want to be in ENG notation.Gabor
I
49

You can specify the format of the colorbar ticks as follows:

pl.colorbar(myplot, format='%.0e')
Irs answered 22/9, 2014 at 21:28 Comment(2)
Thanks, but I would like to see 10^1 10^2, etc rather than e+01,e+02. Is it possible?Orientation
this worked best for meRichelieu
U
14

There is a more straightforward (but less customizable) way to get scientific notation in a ColorBar without the %.0e formatting.

Create your ColorBar:

cbar = plt.colorbar()

And call the formatter:

cbar.formatter.set_powerlimits((0, 0))

This will make the ColorBar use scientific notation. See the example figure below to see how the ColorBar will look.

enter image description here

The documentation for this function can be found here.

Ulcer answered 26/11, 2020 at 22:6 Comment(2)
Do you have a link to the documentation about cbar.formatter.set_powerlimits? I cannot find it. I just wanted to look at what (0,0) meansPerchloride
@Perchloride the documentation is buried on this page: matplotlib.org/stable/api/ticker_api.html The salient info is: "A tuple (min_exp, max_exp) containing the powers of 10 that determine the switchover threshold. For a number representable as 𝑎×10exp with 1<=|𝑎|<10, scientific notation will be used if exp <= min_exp or exp >= max_exp."Ulcer
E
5

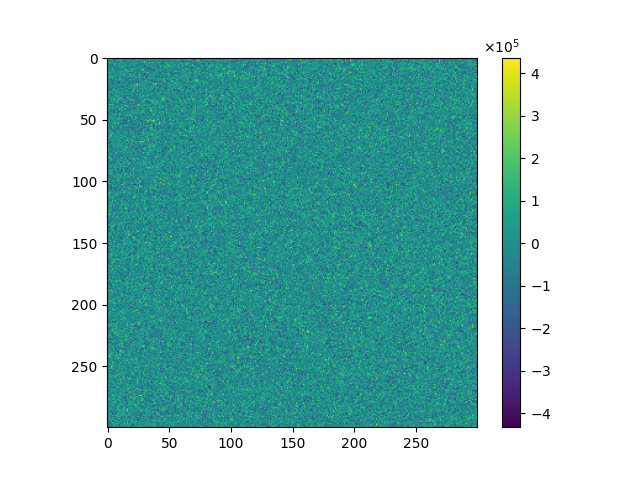
It seems that cbar.formatter.set_powerlimits((0,0)) alone in Joseph's answer does not render math format like $10^3$ yet.

Adding cbar.formatter.set_useMathText(True) gives something like $10^3$.

import matplotlib.pyplot as plt
import numpy as np

img = np.random.randn(300,300)*10**5
myplot = plt.imshow(img)
cbar = plt.colorbar(myplot)
cbar.formatter.set_powerlimits((0, 0))

# to get 10^3 instead of 1e3
cbar.formatter.set_useMathText(True)

plt.show()

This generates enter image description here

See the document of set_useMathText() here.

Escarp answered 16/5, 2022 at 10:43 Comment(0)

© 2022 - 2024 — McMap. All rights reserved.