The Visual Studio 2022 Error "Failed to launch debug adapter. Additional information may be available in the output window."
Asked Answered
A

19

40

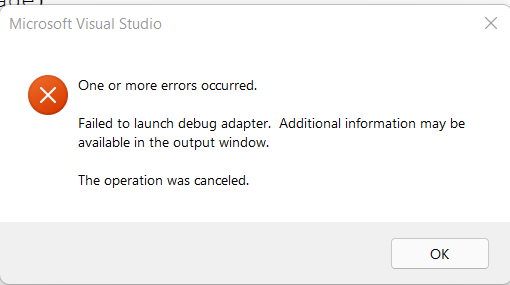
I am using Visual Studio 2022 for Blazor WebAssembly Project and the ASP.NET Core API Project. When I run these projects independently, they works fine in Edge, Chrome browsers but, when I select Multiple-Startup projects, I am getting the following error.


Microsoft Visual Studio

One or more errors occurred.

Failed to launch debug adapter. Additional information may be available in the output window.

The operation was canceled.

OK

enter image description here

Ambo answered 16/12, 2021 at 6:47 Comment(4)
Which version of VS2022? What is the relation between Wasm and API projects? Are they from the Hosted template or did you set up 2 indep projects?Casteel
On what URLs (port numbers) and in which order are they started?Casteel
The API Project is started first and then the WASM Application. The WASM application is calling the API for Authentication. This is really irritating.Ambo
Rebooting my computer solved this for me.Accede
S
49

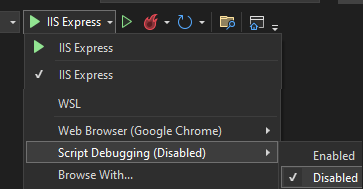
I had the same issue with Visual Studio 2022. I could solve the issue by disabling the script debugging in the drop-down of green arrow where we run the project. Please see the following screenshot.

enter image description here

Surprising answered 4/8, 2022 at 6:12 Comment(1)
Disabling WebView debugging in a winforms app also helped.Matthieu
S
14

I had this issue until I removed this line from launchsettings.json under profiles on the server side code.

Failed to launch debug adapter Unable to launch browser...

"inspectUri": "{wsProtocol}://{url.hostname}:{url.port}/_framework/debug/ws-proxy?browser={browserInspectUri}",
Struma answered 18/8, 2022 at 17:5 Comment(1)
I voted for this because it did work, but unfortunately removing that line prevents breakpoints from binding in Razor views (possibly elsewhere but that's the problem I ended up with). I suppose I should have expected trouble disabling something that's part of a "debug adapter" :-) I've stopped trying to debug framework sources now (which was what caused the initial problem), and re-added the line and everything's working. Except framework source debugging...Sandblast
L
14

One working tweek is disabling JavaScript debugging in either of these two ways:

1. Disabling Script Debugging from IIS

enter image description here

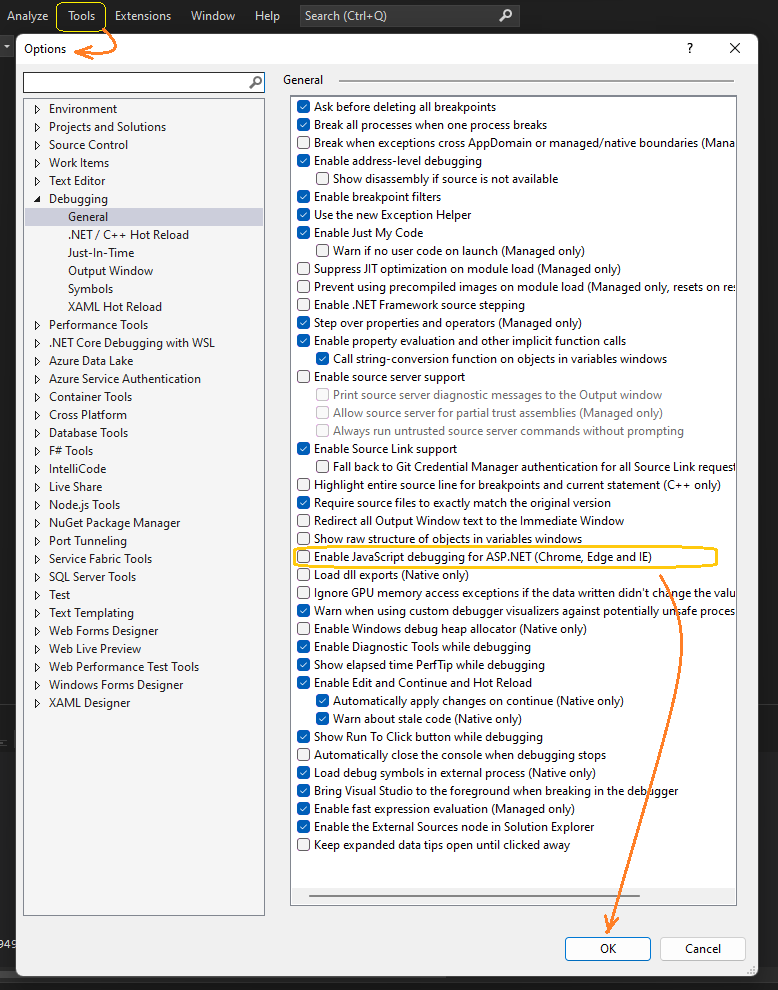
2. Removing the 'Enable' tick from JavaScript Debugging option

enter image description here

Leukas answered 22/9, 2022 at 14:34 Comment(6)
Above screenshot action works for me ThanksBroccoli
Unchecking it doesn't help me.Haight
Sure this workaround works. But I need script debugging. This happened after I upgraded VS.Hezekiah
I have this problem with the latest preview community version (Version 17.6.0 Preview 1.0 ) but Pro 2022 (2) works fine.Hezekiah
They were already both disabled. Still have problem.Horodko
If you're using IIS Express, try resetting it. You can do this by right-clicking the IIS Express icon in the system tray and choosing Stop Site, or by manually killing the process in the Task Manager.Leukas
A
4

Finally..... I resolved by modifying Tools-->Options-->Debugging--->General and enabling following two checkboxes as shown in imageenter image description here

Ambo answered 7/1, 2022 at 12:4 Comment(5)
In my case I had to set 'enable JavaScript debugging for ASP.NET' and 'Enable using the multi-target .... for ASP.NET projects' but not the Node.js setting.Quent
I don't even see those option in Visual Studio 2022 Preview.Davon
Didn't work for me.Darsie
I just closed all browsers and restarted etc. And it workedForfeiture
I have only "Enable Javascript debugging for ASP.NET (Chrome, Edge and IE)". Unchecking it doesn't help.Haight
D
3

For me, just closing the browser solved it.

Diagnose answered 1/6, 2023 at 21:6 Comment(2)
Same here, I had some hidden instances of Edge. Killed them from task manager and it was fixedLister
Same for me in my Blazor WebAssembly application. Solved it by filtering for Edge in the task manager and closing all instances.Sherillsherilyn
S
2

I solved this problem by setting the config "launchBrowser": false for the current profile in the file Properties/launchSettings.json.

It seems there is a browser launch problem. This may be caused by rights issues.

Showoff answered 7/12, 2022 at 5:50 Comment(0)
L
1

Try to stop the site in the IISExpress background process in the system tray of the target project. Then exit the IISExpress background process itself.

enter image description here

Refer to this article:

https://techstrology.com/failed-to-launch-debug-adapter-the-program-has-exited-with-code-1-0xffffffff-visual-studio-failed-and-crashed/

Lotson answered 17/12, 2021 at 2:16 Comment(1)
I am not using IIS Express. I am using.NET Core 6 app.Ambo
J
1

On a related note, I encountered this error message after cloning the first Blazor project I'd worked on in VS 2022.

It turned out that I hadn't installed all the build tools required for the (WebAssembly) Blazor project.

Go to Tools \ Get Tools and Features... then the Individual Components tab.

After adding .NET 6.0 WebAssembly Build Tools and .NET WebAssembly Build Tools I was able to successfully debug the project.

Jota answered 8/12, 2022 at 12:13 Comment(1)
That did it for me, cheersTrangtranquada
C
0

I run into this issue because of powershell restrict mode.

Cannot dot-source this command because it was defined in a different language mode. To invoke this command without importing its contents, omit the '.' operator.

I solve it by the following steps.

  • Download the VsDbg downloaded from https://aka.ms/getvsdbgps1
  • Open the powershell terminal and navigate to the location where the downloaded file is located.
  • Execute - .\GetVsDbg.ps1 -Version vs2017u5 -RuntimeID linux-x64 -InstallPath "C:\Users[YOUR_USER_NAME]\vsdbg\vs2017u5"
  • Execute - .\GetVsDbg.ps1 -Version vs2017u5 -RuntimeID linux-musl-x64 -InstallPath "C:\Users[YOUR_USER_NAME]\vsdbg\vs2017u5\linux-musl-x64"
Conventioneer answered 15/2, 2023 at 9:29 Comment(1)
C:\Users\xxx\AppData\Local\Temp\GetVsDbg.ps1 : Cannot dot-source this command because it was defined in a different language mode. To invoke this command without importing its contents, omit the '.' operator. + CategoryInfo : InvalidOperation: (:) [GetVsDbg.ps1], NotSupportedException + FullyQualifiedErrorId : DotSourceNotSupported,GetVsDbg.ps1Yurikoyursa
P
0

deleting the VSDBG debugger folder located at "%USERPROFILE%\vsdbg\vs2017u5" may help resolve the issue. Once you have deleted this folder, you can restart the debugger by pressing F5. Doing so will trigger the automatic recreation of the VSDBG debugger.

For further information on debug properties, you may want to consult Microsoft's official documentation, which can be found at https://learn.microsoft.com/en-us/visualstudio/containers/container-msbuild-properties?view=vs-2022. This documentation covers the use of various properties in MSBuild files to control the behavior of the debugger in containerized environments.

Protrusile answered 3/4, 2023 at 7:56 Comment(0)
C
0

I wanted to see more info about some Exceptions that my app was raising, so I ticked the following setting in the VS Launch Profiles dialog. But once I'd ticked this I started getting the "Failed to launch debug adapter" error when I tried to debug the app. So I unticked the setting again.

enter image description here

Crwth answered 8/11, 2023 at 17:47 Comment(0)
H
0

I was getting this error alongside the following error in the console:

Invalid value for NO_PROXY: ... (Expected values: "localhost" or "127.0.0.1")

Just like it is documented here, if your environment is using a proxy, then you need to add localhost to your NO_PROXY environment variables.

On Windows:

  1. Open Control Panel
  2. Search for "Environment Variables"
  3. Click "Edit the Environment Variables for your account
  4. Set the variable NO_PROXY to a value of localhost.
Hixson answered 29/11, 2023 at 14:8 Comment(0)
W
0

For me, restarting all instances of Visual Studio worked.

Wether answered 15/12, 2023 at 10:38 Comment(0)
C
0

in launchSettings.json, in profiles object set "jsWebView2Debugging": false, this resolved my issue

Casework answered 18/12, 2023 at 11:28 Comment(0)
A
0

I had renamed my NodeJs folder in C:\Program Files\Microsoft Visual Studio\2022\Professional\MSBuild\Microsoft\VisualStudio as it conflicted with other NodeJS versions installed. By restoring it back to original state, this problem went away.

Airline answered 18/1 at 9:50 Comment(0)
T
0

I started getting this error when attempting to debug a Static Web App, running behind the SWA CLI, with Visual Studio 2022. It had been working previously, so it's likely that some unknown update was responsible for the change in behaviour, but after hours of trying and failing to find the cause I hit upon this workaround.

In my case, the app's launchSettings.json had both a launchUrl and an applicationUrl setting:

  "launchUrl": "http://localhost:4280",
  "applicationUrl": "http://localhost:5080"
  "inspectUri": "{wsProtocol}://{url.hostname}:{url.port}/_framework/debug/ws-proxy?browser={browserInspectUri}",

In this case, the {url.port} placeholder in the inspectUri setting was expanding to the port specified in the launchUrl setting, i.e. 4280 - the port the SWA CLI was running on. Examining the visualstudio-js-debugger.txt file showed that this request was being refused. Changing it to explicitly use the port that the app was running on, i.e. 5080, fixed the problem for me.

  "inspectUri": "{wsProtocol}://{url.hostname}:5080/_framework/debug/ws-proxy?browser={browserInspectUri}"
Tonnie answered 29/2 at 12:7 Comment(0)
P
0

In my case, I got the same error message as the original post, but the Additional Information part indicated that EACCESS to the port for the debugger was denied. I fixed the issue by stopping and restarting the WINNAT service as follows.

net stop winnat

net start winnat
Phanotron answered 18/3 at 1:5 Comment(0)
I
0

For me, the ridiculous problem was build profile being set on Release instead of Debug. It's worth a double-check.

Incardination answered 20/4 at 8:58 Comment(0)
D
-2

I was able to resolve this issue by selecting a newer version of python in the debug properties. To do that, go to Debug>ProjectName Debug Properties>General. In that window select a newer python version next to Interpreter. In my case, Python 3.9 worked.

If no other python versions are displayed, you will have to install a newer version of python. I was making a console application and this is the only thing that worked.

Drink answered 10/12, 2022 at 0:46 Comment(0)

© 2022 - 2024 — McMap. All rights reserved.