Audio Frequencies in Python
Asked Answered
R

1

8

I'm writing a code to analyse a single audio frequency sung by a voice. I need a way to analyse the frequency of the note. Currently I am using PyAudio to record the audio file, which is stored as a .wav, and then immediately play it back.

import numpy as np
import pyaudio
import wave

# open up a wave
wf = wave.open('file.wav', 'rb')
swidth = wf.getsampwidth()
RATE = wf.getframerate()
# use a Blackman window
window = np.blackman(chunk)
# open stream
p = pyaudio.PyAudio()
stream = p.open(format =
                p.get_format_from_width(wf.getsampwidth()),
                channels = wf.getnchannels(),
                rate = RATE,
                output = True)

# read some data
data = wf.readframes(chunk)

print(len(data))
print(chunk*swidth)

# play stream and find the frequency of each chunk
while len(data) == chunk*swidth:
    # write data out to the audio stream
    stream.write(data)
    # unpack the data and times by the hamming window
    indata = np.array(wave.struct.unpack("%dh"%(len(data)/swidth),\
                                         data))*window
    # Take the fft and square each value
    fftData=abs(np.fft.rfft(indata))**2
    # find the maximum
    which = fftData[1:].argmax() + 1
    # use quadratic interpolation around the max
    if which != len(fftData)-1:
        y0,y1,y2 = np.log(fftData[which-1:which+2:])
        x1 = (y2 - y0) * .5 / (2 * y1 - y2 - y0)
        # find the frequency and output it
        thefreq = (which+x1)*RATE/chunk
        print("The freq is %f Hz." % (thefreq))
    else:
        thefreq = which*RATE/chunk
        print("The freq is %f Hz." % (thefreq))
    # read some more data
    data = wf.readframes(chunk)
if data:
    stream.write(data)
stream.close()
p.terminate()

The problem is with the while loop. The condition is never true for some reason. I printed out the two values (len(data) and (chunk*swidth)), and they were 8192 and 4096 respectively. I then tried using 2*chunk*swidth in the while loop, which threw this error:

File "C:\Users\Ollie\Documents\Computing A Level CA\pyaudio test.py", line 102, in <module>
data))*window
ValueError: operands could not be broadcast together with shapes (4096,) (2048,)
Ralli answered 14/11, 2018 at 21:3 Comment(2)
Scipy has signal processing, and this answer discusses other possibilitiesOutroar
Binary, hex and decimal all represent the same thing. 0xA=10=1010. Just running your data through an FFT won't give you the fundamental frequency. The voice produces multiple frequencies and, as such, you need to do more processing and analysis to get the frequency.Observance
K
17

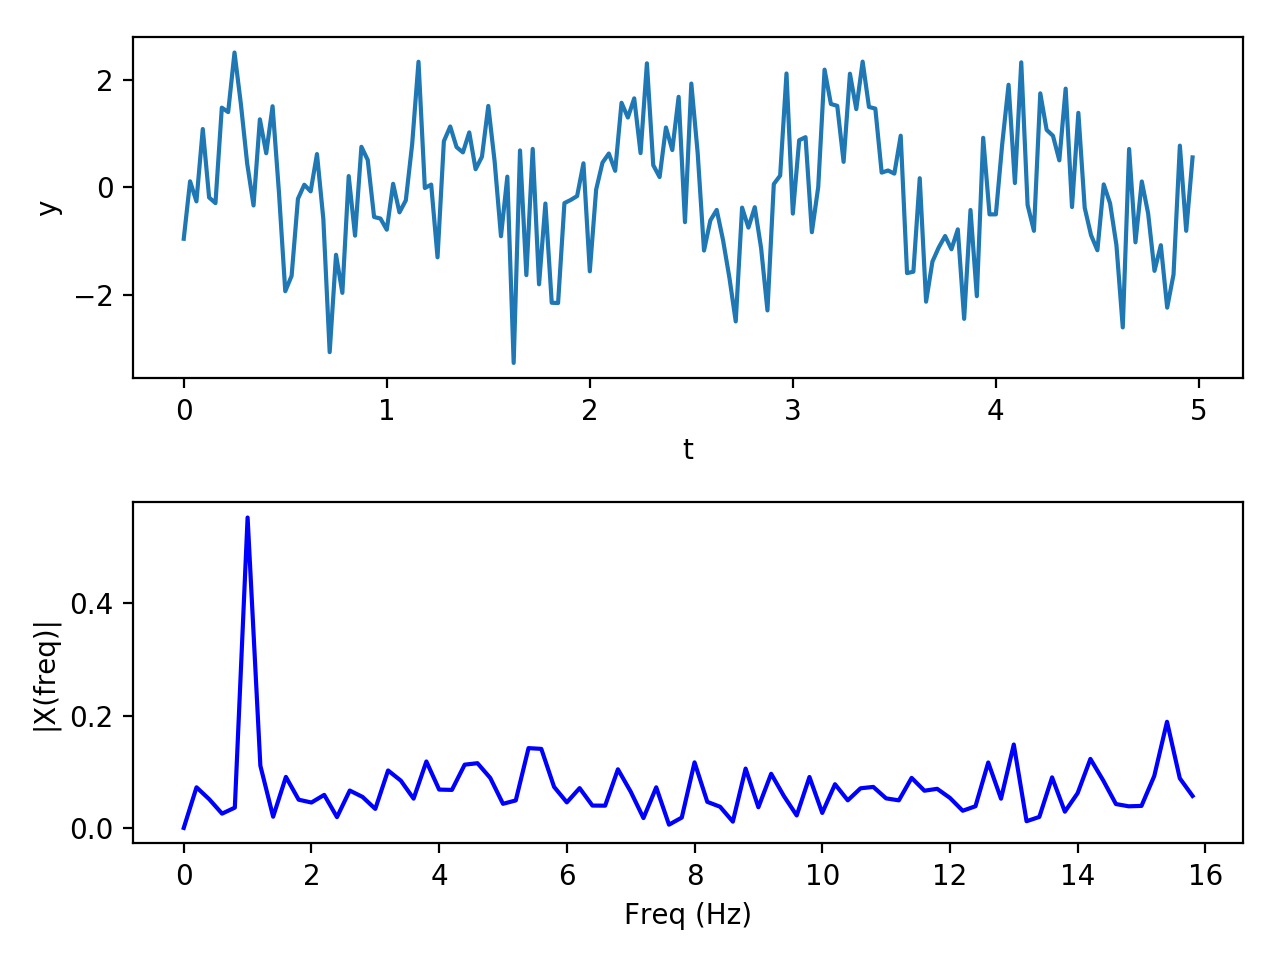
This function below finds the frequency spectrum. I have also included a sine signal and a WAV file sample application. This is for educational purposes; you may alternatively use the readily available matplotlib.pyplot.magnitude_spectrum (see below).

from scipy import fft, arange
import numpy as np
import matplotlib.pyplot as plt
from scipy.io import wavfile
import os


def frequency_spectrum(x, sf):
    """
    Derive frequency spectrum of a signal from time domain
    :param x: signal in the time domain
    :param sf: sampling frequency
    :returns frequencies and their content distribution
    """
    x = x - np.average(x)  # zero-centering

    n = len(x)
    k = arange(n)
    tarr = n / float(sf)
    frqarr = k / float(tarr)  # two sides frequency range

    frqarr = frqarr[range(n // 2)]  # one side frequency range

    x = fft(x) / n  # fft computing and normalization
    x = x[range(n // 2)]

    return frqarr, abs(x)


# Sine sample with a frequency of 1hz and add some noise
sr = 32  # sampling rate
y = np.linspace(0, 2*np.pi, sr)
y = np.tile(np.sin(y), 5)
y += np.random.normal(0, 1, y.shape)
t = np.arange(len(y)) / float(sr)

plt.subplot(2, 1, 1)
plt.plot(t, y)
plt.xlabel('t')
plt.ylabel('y')

frq, X = frequency_spectrum(y, sr)

plt.subplot(2, 1, 2)
plt.plot(frq, X, 'b')
plt.xlabel('Freq (Hz)')
plt.ylabel('|X(freq)|')
plt.tight_layout()


# wav sample from https://freewavesamples.com/files/Alesis-Sanctuary-QCard-Crickets.wav
here_path = os.path.dirname(os.path.realpath(__file__))
wav_file_name = 'Alesis-Sanctuary-QCard-Crickets.wav'
wave_file_path = os.path.join(here_path, wav_file_name)
sr, signal = wavfile.read(wave_file_path)

y = signal[:, 0]  # use the first channel (or take their average, alternatively)
t = np.arange(len(y)) / float(sr)

plt.figure()
plt.subplot(2, 1, 1)
plt.plot(t, y)
plt.xlabel('t')
plt.ylabel('y')

frq, X = frequency_spectrum(y, sr)

plt.subplot(2, 1, 2)
plt.plot(frq, X, 'b')
plt.xlabel('Freq (Hz)')
plt.ylabel('|X(freq)|')
plt.tight_layout()

plt.show()

Sine signal


WAV file

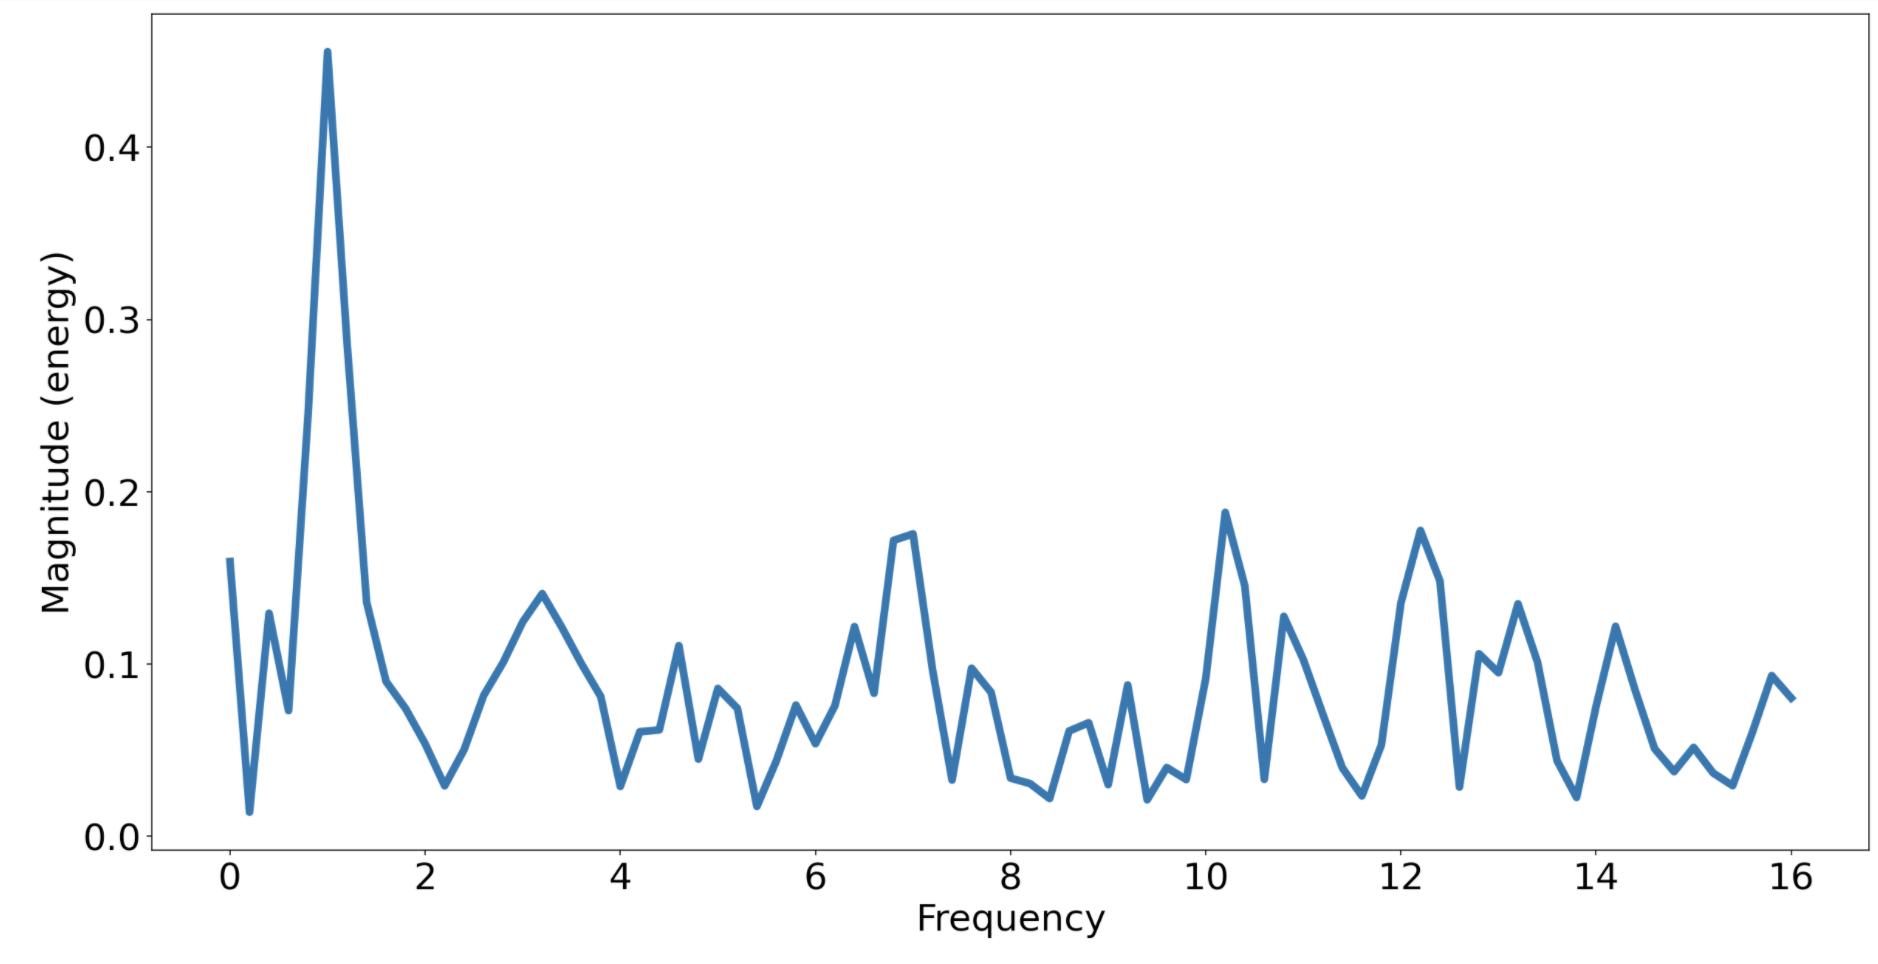
You may also refer to SciPy's Fourier Transforms and Matplotlib's magnitude spectrum plotting pages for extra reading and features.

magspec = plt.magnitude_spectrum(y, sr)  # returns a tuple with the frequencies and associated magnitudes

enter image description here

Ketone answered 14/11, 2018 at 21:45 Comment(5)
Hi, this works really well for the sine waves, but what do I need to change to change the input to be a wav file? I've tried just replacing y with the array of data, but it doesn't seem to work.Ralli
Did you set your array's mean to 0 first? I went ahead and moved this step to the function itself. I have the wav to array converter code somewhere too; will add here soon.Ketone
added a wav example.Ketone
Thank you, it works really well. If you want to print out the frequency, you need to find the maximum value in X, then use the same index from the frq array.Ralli
If you run the code above "as is," you will get the error "TypeError: 'module' object is not callable". Changing line 24 to " x = fft.fft(x) / n # fft computing and normalization" addresses this issue. You may also a deprecation warning for scipy.arange and the recommendation to use numpy.arange.Cardenas

© 2022 - 2024 — McMap. All rights reserved.