I am trying use profiling to see which part of my code is reposponsible for the maximum usage of 3GB of memory (as reported by gc() statistic on maximum used memory, see here how). I am running memory profiling like this:
Rprof(line.profiling = TRUE, memory.profiling = TRUE)
graf(...) # ... here I run the profiled code
Rprof(NULL)
summaryRprof(lines = "both", memory = "both")
And the output is the following:
$by.total
                       total.time total.pct mem.total self.time self.pct
"graf"                     299.12     99.69   50814.4      0.02     0.01
#2                         299.12     99.69   50814.4      0.00     0.00
"graf.fit.laplace"         299.06     99.67   50787.2      0.00     0.00
"doTryCatch"               103.42     34.47    4339.2      0.00     0.00
"chol"                     103.42     34.47    4339.2      0.00     0.00
"tryCatch"                 103.42     34.47    4339.2      0.00     0.00
"tryCatchList"             103.42     34.47    4339.2      0.00     0.00
"tryCatchOne"              103.42     34.47    4339.2      0.00     0.00
"chol.default"             101.62     33.87    1087.0    101.62    33.87
graf.fit.laplace.R#46       85.80     28.60    3633.2      0.00     0.00
"backsolve"                 78.82     26.27    1635.2     58.40    19.46
How shall I interpret mem.total? What is it and what is the unit of it? I tried to look at the documentation, namely ?Rprof and ?summaryRprof, but it seems it's not well documented :-/
EDIT: Here they say that Rprof "probes the total memory usage of R at regular time intervals". But that doesn't fit to the 50GB which are way beyond what my memory is able to fit! (8GB physical + 12 GB pagefile now).
Similarly, as pointed out by R Yoda, ?summaryRprof says that with memory = "both" it means "the change in total memory". But what is it exactly (is it a total memory or change of total memory), and how does it fit with the 50GB number?
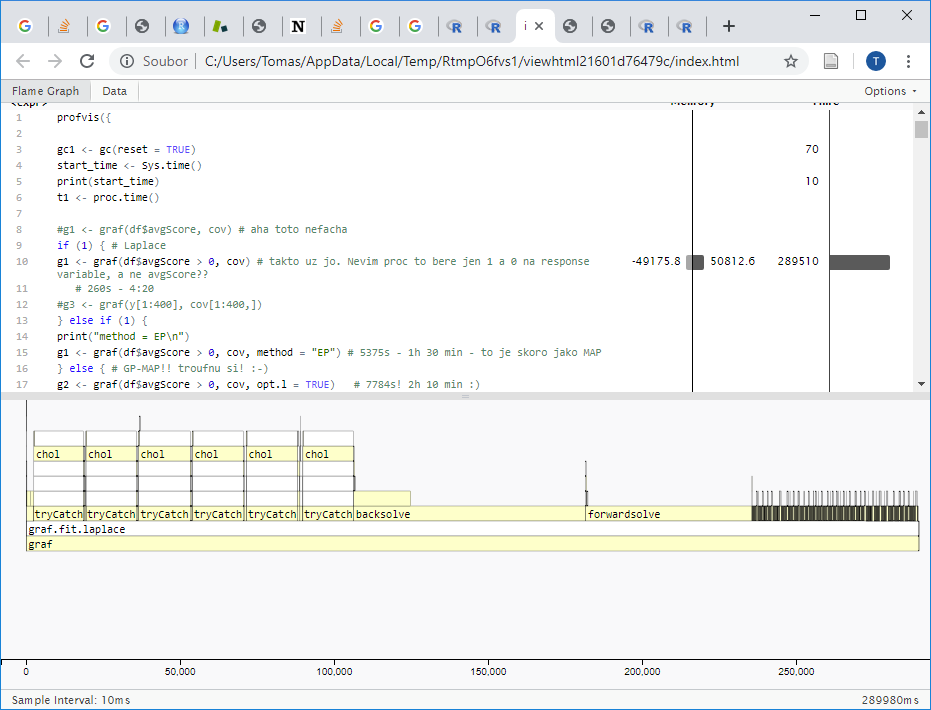
EDIT: the same analysis done in profvis - when i hover ovew the 50812, it shows "Memory allocation (MB)", and hover over the black bar close to that vertical line "Percentage of peak memory allocation and deallocation". Not sure what that means... This is like 50 GB, which means like this may be perhaps the sum of all allocations (??) ... definitely not the peak memory usage:


profvisgave me the same numbers and marked as MB! This could mean that there is an error in that book! But anyway it seems that it's all allocations summed up, not the memory used at a single time. See my update. – Hypogynous?summaryRprofsays: "If memory = "both" the same list but with memory consumption in Mb in addition to the timings.". So I would say MB is right. Help is also saying: "With memory = "both" the change in total memory (truncated at zero) is reported in addition to timing data" – Paradox