How to use Opencv contours to describe line points in a unidirectional way
Asked Answered
L

1

8

I am using opencvs findContour to find the points to describe an image made up of lines (not polygons) as such: cv::findContours(src, contours, hierarchy, cv::RETR_EXTERNAL, cv::CHAIN_APPROX_SIMPLE);.

Lesalesak answered 25/3, 2020 at 20:9 Comment(9)
Contours are closed shapes. You won't get lines out of findContours.Merryman
Is there anyway to remove those points? One thing I did was just remove the second half of the contour which seemed to do okay. I also was thinking approxPolyDP may be able to help. Is there something other than a contour which may do what I want?Lesalesak
Can you include example images?Merryman
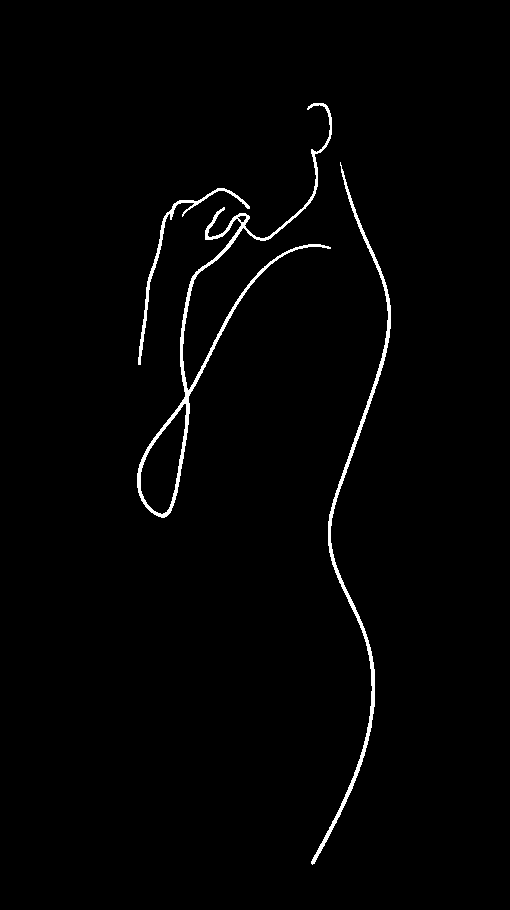
I have attached a possible sample input. it could be or less complexLesalesak
I don't think you can use contours for the reason @Merryman mentioned. What is your end goal? We could help maybe to find another approach. It would also help if you could post an example of what you expect the output to look like.Minos
The end goal would be to be given back a list of lists of points, such that each list in the list represents a line segment in the image. Thus, the image can be reconstructed from this list of lists of points, by connecting adjacent points in each list. findContours gives very close to what I want, the only problem being that it traces back on itself.Lesalesak
I have added an other image where I colour possible contours. The main thing being, that each contour is a list of ordered points which can be used to recreate something similar to the image. Want I was is actually very similar to edge detection.Lesalesak
Another thing to note: I have dilated my line drawings as to connect them. the line drawings were very thin, and so they were creating a ton of contours because they were disjoint in so many places. To fix this, i have used cv::dilateLesalesak
Note once I dilate, the contours I get actually describe something interesting (and possibly easier to deal with). The line that i would want to return, is precisely the line in the middle of the contour, if that makes sense. I have attached another image. In gray is the contour described after i dilate the line. The red line in the middle would be the line I want to return. Is there a way of somehow "averaging" the inner and outer contours in order to get that middle line?Lesalesak
E
11

If I understand correctly, the "cv2.connectedComponents" method gives what you are looking for. It assigns a label for each point in your image, the label is the same if points are connected. By doing this assignment there is no duplication happening. So, if your lines are one pixel wide (e.g output of an edge detector or a thinning operator) you get one point per location.

Edit:

As per the OP request, lines should be 1-pixel wide. To achieve this a thinning operation is applied before finding connected components. Steps images have been added too.

Please note that each connected component points are sorted in ascending order of y cords.

img_path = "D:/_temp/fig.png"
output_dir = 'D:/_temp/'

img = cv2.imread(img_path, cv2.IMREAD_GRAYSCALE)

_, img = cv2.threshold(img, 128, 255, cv2.THRESH_OTSU + cv2.THRESH_BINARY_INV)

total_white_pixels = cv2.countNonZero(img)
print ("Total White Pixels Before Thinning = ", total_white_pixels)

cv2.imwrite(output_dir + '1-thresholded.png', img)

#apply thinning -> each line is one-pixel wide
img = cv2.ximgproc.thinning(img)
cv2.imwrite(output_dir + '2-thinned.png', img)

total_white_pixels = cv2.countNonZero(img)
print ("Total White Pixels After Thinning = ", total_white_pixels)

no_ccs, labels = cv2.connectedComponents(img)

label_pnts_dic = {}

colored = cv2.cvtColor(img, cv2.COLOR_GRAY2BGR)

i = 1 # skip label 0 as it corresponds to the backgground points
sum_of_cc_points = 0 
while i < no_ccs:
    label_pnts_dic[i] = np.where(labels == i) #where return tuple(list of x cords, list of y cords)
    colored[label_pnts_dic[i]] = (random.randint(100, 255), random.randint(100, 255), random.randint(100, 255))
    i +=1

cv2.imwrite(output_dir + '3-colored.png', colored)    


print ("First ten points of label-1 cc: ")
for i in range(10):
    print ("x: ", label_pnts_dic[1][1][i], "y: ", label_pnts_dic[1][0][i])

Output:

Total White Pixels Before Thinning =  6814
Total White Pixels After Thinning =  2065
First ten points of label-1 cc: 
x:  312 y:  104
x:  313 y:  104
x:  314 y:  104
x:  315 y:  104
x:  316 y:  104
x:  317 y:  104
x:  318 y:  104
x:  319 y:  104
x:  320 y:  104
x:  321 y:  104

Images:

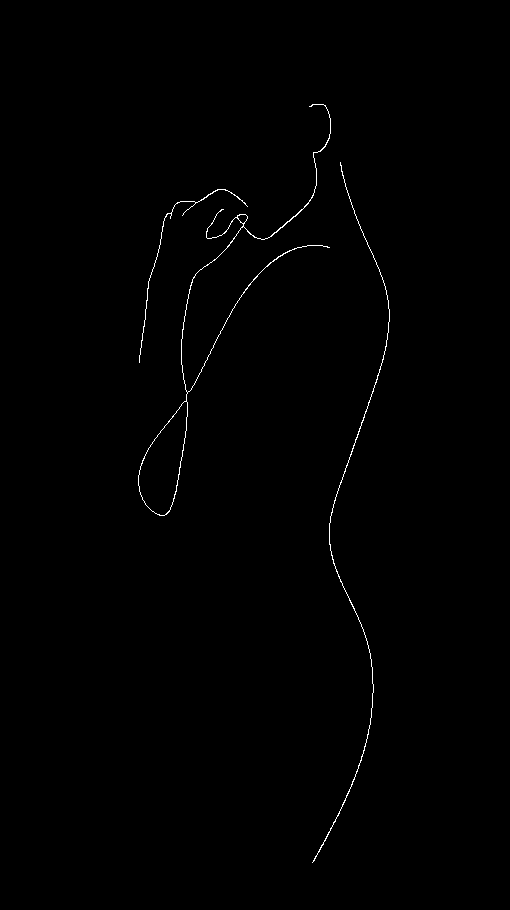
1.Thresholded

enter image description here

  1. Thinned

enter image description here

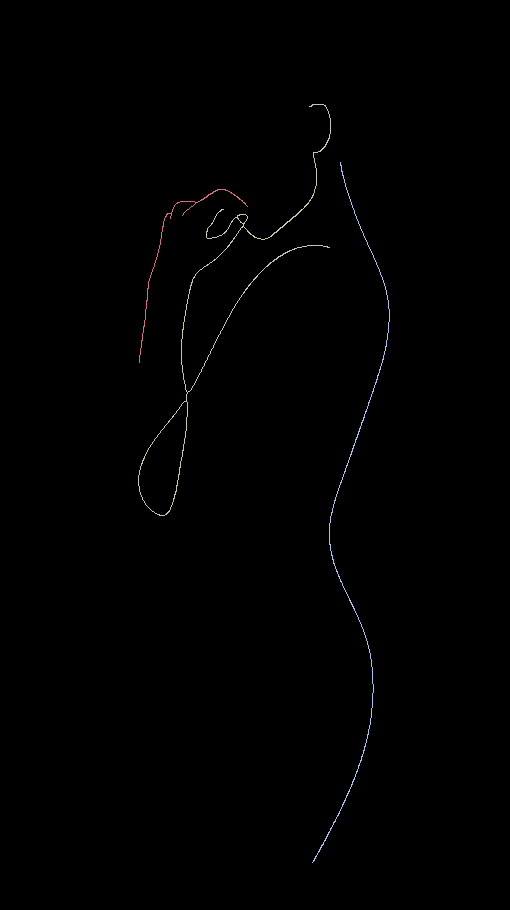
  1. Colored Components

enter image description here

Edit2:

After a discussion with OP, I understood that having a list of (scattered) points is not enough. Points should be ordered so that they could be traced. To achieve that new logic should be introduced after applying thinning to the image.

  1. Find extreme points (points with a single 8-connectivity neighbor)
  2. Find connector points (points with 3-ways connectivity)
  3. Find simple points (all other points)
  4. Start tracing from an extreme point until reaching another extreme point or a connector one.
  5. Extract the traveled path.
  6. Check whether a connector point has turned into a simple point and update its status.
  7. Repeat
  8. Check if there are any closed-loops of simple points that have not been reached from any extreme point, extract each closed-loop as an additional waypoint.

Code for extreme/connector/simple point classification

def filter_neighbors(ns):    
    i = 0
    while i < len(ns):
        j = i + 1
        while j < len(ns):
            if (ns[i][0] == ns[j][0] and abs(ns[i][1] - ns[j][1]) <= 1) or (ns[i][1] == ns[j][1] and abs(ns[i][0] - ns[j][0]) <= 1):
                del ns[j]
                break                                    
            j += 1
        i += 1    

def sort_points_types(pnts):
    extremes = []
    connections = []
    simple = []

    for i in range(pnts.shape[0]):
        neighbors = []
        for j in range (pnts.shape[0]):
            if i == j: continue
            if abs(pnts[i, 0] - pnts[j, 0]) <= 1 and abs(pnts[i, 1] - pnts[j, 1]) <= 1:#8-connectivity check
                neighbors.append(pnts[j])
        filter_neighbors(neighbors)
        if len(neighbors) == 1:
            extremes.append(pnts[i])
        elif len(neighbors) == 2:
            simple.append(pnts[i])
        elif len(neighbors) > 2:
            connections.append(pnts[i])
    return extremes, connections, simple


img_path = "D:/_temp/fig.png"
output_dir = 'D:/_temp/'

img = cv2.imread(img_path, cv2.IMREAD_GRAYSCALE)

_, img = cv2.threshold(img, 128, 255, cv2.THRESH_OTSU + cv2.THRESH_BINARY_INV)
img = cv2.ximgproc.thinning(img)

pnts = cv2.findNonZero(img)
pnts = np.squeeze(pnts)


ext, conn, simple = sort_points_types(pnts)

for p in conn:
    cv2.circle(img, (p[0], p[1]), 5, 128)

for p in ext:
    cv2.circle(img, (p[0], p[1]), 5, 128)

cv2.imwrite(output_dir + "6-both.png", img)

print (len(ext), len(conn), len(simple))

Edit3:

A much more efficient implementation for classifying the points in a single pass by checking neighbors in a kernel-like way, thanks to eldesgraciado!

Note: Before calling this method the image should be padded with one pixel to avoid border checks or equivalently blackout pixels at the border.

def sort_points_types(pnts, img):
    extremes = []
    connections = []
    simple = []

    for p in pnts:
        x = p[0]
        y = p[1]
        n = []
        if img[y - 1,x] > 0: n.append((y-1, x))
        if img[y - 1,x - 1] > 0: n.append((y-1, x - 1))
        if img[y - 1,x + 1] > 0: n.append((y-1, x + 1))
        if img[y,x - 1] > 0: n.append((y, x - 1))
        if img[y,x + 1] > 0: n.append((y, x + 1))
        if img[y + 1,x] > 0: n.append((y+1, x))
        if img[y + 1,x - 1] > 0: n.append((y+1, x - 1))
        if img[y + 1,x + 1] > 0: n.append((y+1, x + 1))
        filter_neighbors(n)
        if len(n) == 1:
            extremes.append(p)
        elif len(n) == 2:
            simple.append(p)
        elif len(n) > 2:
            connections.append(p)
    return extremes, connections, simple

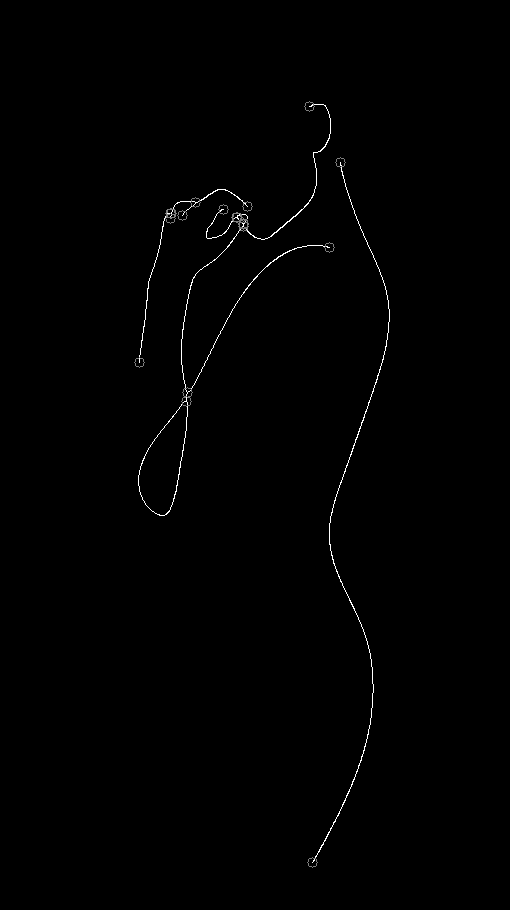
An image visualizing extreme and connector points:

enter image description here

Efflorescent answered 29/3, 2020 at 10:54 Comment(18)
The problem will be that my lines are not 1 pixel thick. i have used dilate in order to better connect. So i think this will give too many points. Also, for the example I showed above, wont this only give one line? I would prefer to have serveral. And each line should be an ordered sequence of pointsLesalesak
For the example above it gives three components. 1. The back. 2. The face and the left thumb. 3. The outer side of the hand. So I guess this method should be good regarding this aspect. In OpenCV contribution, there's an implemented thinning/skeleton algorithm (makes lines 1 point) wide) I will add an edit including the thinning code and the output (should have much less points per line). Please have a look at it.Efflorescent
This looks good, but isn't this still tracing back on itself? For example, the fingers that are in red, how are these coming from a single set of points? are you able to plot the points? If you look at the top right line in red, it must be tracing that line, then going back up it to continue. Maybe I am misunderstanding something. Visually, however, it looks good.Lesalesak
This solution solves the original problem that you mentioned in your question which is that the contour describes the image twice. This is no longer the case as the points provided by this answer are only passed/represented once.Efflorescent
Oh I did not realize that. Are you able to show how the part of the red hand is being represented? I thought that it would need to backtrack at a few points, wouldn't it?Lesalesak
I would be interested in seeing the ordering of the points representing this image. In my original question, I had shown that I was expecting each line to be its own "colour", and this seems to have less lines than I was expecting.Lesalesak
After applying the connected components code, you get a list of points. These points are pixels locations that could be randomly accessed to assign a value/color. These points might be scattered but still, they are unique i.e. do not have the problem of the "find contours" method mentioned in the question.Efflorescent
Let us continue this discussion in chat.Efflorescent
Edited again. @izaEfflorescent
Hi therre, what is step 6) Check whether a connector point has turned into an extreme point, for again?Lesalesak
Assume you have a cross shape.You have 4 extreme pnts and a connector pnt. For the first 2 extreme pnts, you start from the extreme pnt till you reach the center, extract the waypoint and remove its pnts. Now the connector pnt at the center is no longer a connector point. In fact, it is now a simple pnt. And you can now trace from the 3rd extreme point to the 4th one immediately. And you will end up with 3 lines instead of 4 if you haven't updated the status of the connector point in the middle. In this example the connector point becomes a simple pnt maybe it becomes an ext in anotherEfflorescent
I think I made a mistake, the connector point cannot turn into an extreme point. It can only turn into a simple point. I will edit the answer.Efflorescent
@Efflorescent Very nice solution, my friend. Here's just an idea to find connector points - how about a Hit-or-Miss operation to find ending/starting points? OP's contours are 1-pixel wide, so the kernel(s) needed should be simple enough. I haven't tested it myself, but it could yield an alternative/complementary solution. Nevertheless, very cool work so far!Dust
Edited. Added logic for a missing case, an isolated circle.Efflorescent
@eldesgraciado thanks for the suggestion. I avoided that fearing that the Hit-or-Miss operation could be computationally expensive. Do you have any idea if it could be any faster than my method? BTW, mine is based on this https://mcmap.net/q/394463/-finding-intersections-of-a-skeletonised-image-in-python-opencvEfflorescent
@Efflorescent Ah! I see. Sadly, I can’t say which method is faster. With the hit/miss approach, multiple passes through the image are needed. But, here’s another idea: Your approach involves applying complementary kernels of 3x3 to determine if a point is a "target" point. What can be done is to obtain logic expressions for each kernel “pixel” - You examine the kernels, determine in which cases, pixel(0,0), for example, must return true. You will obtain a set of boolean functions for each pixel. You evaluate the set of “logical rules” in one pass and determine which input pixel is a target point.Dust
@eldesgraciado that's a great idea. I edited the code. Now it is much fasterEfflorescent
@Efflorescent No problem, my friend! Glad the suggestion was useful!Dust

© 2022 - 2024 — McMap. All rights reserved.