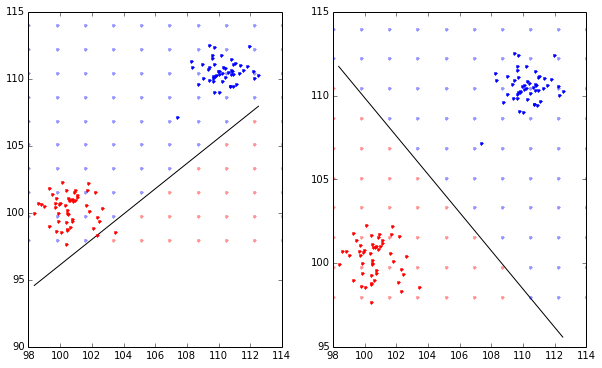
When data is offset (not centered in zero), LinearSVC() and SVC(kernel='linear') are giving awfully different results. (EDIT: the problem might be it does not handle non-normalized data.)
import matplotlib.pyplot as plot
plot.ioff()
import numpy as np
from sklearn.datasets.samples_generator import make_blobs
from sklearn.svm import LinearSVC, SVC


def plot_hyperplane(m, X):
    w = m.coef_[0]
    a = -w[0] / w[1]
    xx = np.linspace(np.min(X[:, 0]), np.max(X[:, 0]))
    yy = a*xx - (m.intercept_[0]) / w[1]
    plot.plot(xx, yy, 'k-')

X, y = make_blobs(n_samples=100, centers=2, n_features=2,
                  center_box=(0, 1))
X[y == 0] = X[y == 0] + 100
X[y == 1] = X[y == 1] + 110

for i, m in enumerate((LinearSVC(), SVC(kernel='linear'))):
    m.fit(X, y)
    plot.subplot(1, 2, i+1)
    plot_hyperplane(m, X)

    plot.plot(X[y == 0, 0], X[y == 0, 1], 'r.')
    plot.plot(X[y == 1, 0], X[y == 1, 1], 'b.')

    xv, yv = np.meshgrid(np.linspace(98, 114, 10), np.linspace(98, 114, 10))
    _X = np.c_[xv.reshape((xv.size, 1)), yv.reshape((yv.size, 1))]
    _y = m.predict(_X)

    plot.plot(_X[_y == 0, 0], _X[_y == 0, 1], 'r.', alpha=0.4)
    plot.plot(_X[_y == 1, 0], _X[_y == 1, 1], 'b.', alpha=0.4)

plot.show()
This is the result I get:
(left=LinearSVC(), right=SVC(kernel='linear'))
sklearn.__version__ = 0.17. But I also tested in Ubuntu 14.04, which comes with 0.15.
I thought about reporting the bug, but it seems too evident to be a bug. What am I missing?


