IntelliJ IDEA Debugger isn't working on a Grails Project
Asked Answered
A

11

41

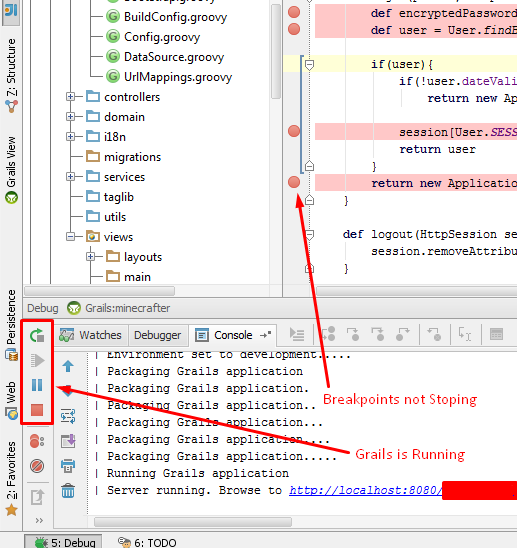
I can't debug my code in IntelliJ IDEA. When debug mode is active and running, but the breakpoints don't have that "v" checked that represents a valid and stoppable breakpoint.

See the image:

enter image description here

I really search on the web for an answer. What am I supposed to do?

Always answered 8/10, 2013 at 12:39 Comment(3)
Did it ever work? I've had situations where intellij and grails got out of sync so debugging stopped working because intellij didn't "realize" that code. A 'grails clean' fixes this pretty quickly. What version of Intellij and Grails?Milfordmilhaud
I'm using the latest version. Grails 2.3.0 and Intellij 12.1.5. The Clean command doesn't work too. I realized that project folder inside .grails/2.3.0/projects wasn't created.Always
This happened to me when I incorrectly set "debug: true" in the compile settings under "grails.project.fork".Negress
C
76

I have tried all mentioned here without success. The only helpful information is here.

In essence you should disable forked execution by adding the following to grails-app/conf/BuildConfig.groovy:

grails.project.fork = [
    test: false,
    run: false
]

Now debugging is available in IntelliJ IDEA Ultimate Edition v.12.1.6 just by ordinary Debug without Remote debugging. Tested on Grails 2.3.1, Java 1.7.0_45, Windows 7 64-bit.

Curzon answered 4/11, 2013 at 22:28 Comment(11)
Tested on Grails 2.3.4 and IntelliJ 13 as well +1. Working.Drayton
Tested on Grails 2.3.8 and IntelliJ 13.1.3 as well +1 Working.Snashall
Tested on Grails 2.4.0 and IntelliJ 13.1.3 - all working! I personally just commented the run and test lines that were in the aforementioned config map.Urge
Tested on Grails 2.4.2 and IntelliJ 13.1.3 - works by simply commenting out the runt / test lines as @atc mentioned.Minnaminnaminnie
Thank you Igors. Your solution solves this problem. Tested in Grails 2.3.4, 2.3.11 and 2.4.2 and IDEA 13.1.3.Always
Tested on Grails 2.4.4 and IntelliJ 14.0.3 - works fine.Eichhorn
If anyone is having an issue getting this working, you may have made the same mistake as me: check whether you have an existing grails.project.fork block generated by the framework which should be updated with these lines instead of creating a new block.Transmutation
Tested on Grails 2.4.4 and Intellij 14.1.2. Works fine. We actually used grails.project.fork = false but that did not work anymore when I upgraded from Intellij 14.1.1 to 14.1.2. Now I applied the solution to this question.Nonprofit
This will work but you should be aware what forking means. Good article hereAldred
Tested on Grails 2.5.0 and IntelliJ 14.1.4 not workingValley
Thank you from the future! This was really helpful. Tested on Grails 2.4.5 and Intellij 17.0.6Motivation
C
18

Try this:

In idea choose Edit configurations from list next to 'run' button. Then add Remote, choose your name and left default remote configuration settings. (port 5005 etc)

Run your app from console by using

grails run-app --debug-fork

In idea, choose your configuration from list and hit debug button when console display info:

Listening for transport dt_socket at address: 5005
Caviar answered 8/10, 2013 at 22:25 Comment(1)
This is what I was looking for. The key was setting up a new Remote debug config instead of using the debug config that IntelliJ was automatically trying to insert for my grails app based on my app's code. I used grails -debug run-app for my console command, then ran the new Remote config in debug mode from IntelliJ and it hooked right into my grails app.Auspicate
C
8

Since Grails 2.3, forked execution for several Grails commands (e.g. run-app, test-app) was introduced. If you just debug a Grails application from IntelliJ IDEA, the GrailsStarter process will be started with debug options on. The output on the IDEA console will be:

/usr/lib/jvm/default-java/bin/java -agentlib:jdwp=transport=dt_socket,address=127.0.0.1:59935,suspend=y,server=n [...] /opt/idea-IU-133.330/lib/idea_rt.jar org.codehaus.groovy.grails.cli.support.GrailsStarter [...] run-app Connected to the target VM, address: '127.0.0.1:59935', transport: 'socket'

The application itself will be started in a separate process named ForkedTomcatServer. This is where your code runs and where your debugger should actually connect to.

To accomplish that, set debug: true in BuildConfig.groovy at the run configuration of grails.project.fork. Just run Grails now from IDEA (do not debug) and you will see the following line in the console when the application is ready to serve HTTP requests:

Listening for transport dt_socket at address: 5005

This is where you want to direct a separate remote run configuration to. As soon as your remote debugger connected, issue a HTTP request and debugging will work.

You can also disable forked execution for compile/test/run/war/console Grails commands entirely by setting the value associated with the command entry in grails.project.fork to false. But then you will lose the benefits for forked execution added in Grails 2.3.

Campeche answered 20/12, 2013 at 11:12 Comment(1)
Thank you, this got me in the right track. Ted Naleid provides a nice summary and details the pros and cons of disabling forked execution for debugging, with two useful alternatives: naleid.com/blog/2014/11/10/debugging-grails-forked-modeEichhorn
P
6

Debugging a grails (2.3+) application can be done in two ways.

1. Simple solution: disable debug

edit BuildConfig.groovy:

grails.project.fork = [
    war: [maxMemory: 768, minMemory: 64, debug: false, maxPerm: 256, fork ...
    run: [maxMemory: 768, minMemory: 64, debug: false, maxPerm: 256, fork ...

to

grails.project.fork = [
    war: [maxMemory: 768, minMemory: 64, debug: false, maxPerm: 256, fork ...
    run: false,

Pros:

  • Simple to do (and get on with your development)

Cons:

  • This removes the ability to perform runtime code replacement. This means that if you change code, it will no longer be picked up automatically and you will need to restart the application to see the changes. This can be very time consuming.

2. Involved solution: debug forked runtime

This is a somewhat more complex solution where you attach a debugger to a running grails application. It is described in more detail in this blog post.

After setup you have an extra run configuration that allows you to start up grails in forked mode, and yet another extra run configuration that allows you to debug that forked mode. The catch is that you are required to start both or it does not work.

Pros:

  • You have both debugging and runtime code replacement
  • This does not interfere with starting the application in normal mode. (i.e. you have extra options)

Cons:

  • Setting up takes a little bit of time
  • Starting up in debug mode requires is a more complex two step process (i.e. it takes longer)

Considerations

Solution 2 is mostly superior in the sense that it allows flexibility. I personally don't use debug a lot, so just start in normal mode. When I want to debug, I restart in debug mode.

Solution 1 is strictly better if you need to debug and also need to restart a lot. For instance when you are working on your domain classes or database setup in your BootStrap.groovy.

Parquetry answered 29/10, 2014 at 11:40 Comment(0)
L
5

None of the other answers work for me on Grails 3.x in 2016 w/ Intellij 15.0.4. This does work for me:

Start grails in intellij with this command:

run-app  --debug-jvm

The console should output: "Listening for transport dt_socket at address: 5005 Grails application running at http://localhost:8080 in environment: development"

Now you can add a new configuration of type, "Remote", in Intellij. Then start it with its defaults.

And the new debug console window should write: "Connected to the target VM, address: 'localhost:5005', transport: 'socket'"

Done.

For those interested, the reference to grails 3.x documentation for starting a debuggable server is at section 2.8, runningAndDebuggingAnApplication:

http://grails.github.io/grails-doc/3.1.x/guide/gettingStarted.html#runningAndDebuggingAnApplication

"There are several ways to execute the Application class, if you are using an IDE then you can simply right click on the class and run it directly from your IDE which will start your Grails application. This is also useful for debugging since you can debug directly from the IDE without having to connect a remote debugger when using the run-app --debug-jvm command from the command line."

Important Note. When I tried the "simply right click on the class and run it directly from your IDE", the app did start. However, all requests I sent to my controller resulted in 500 errors with message: "Could not resolve view with name '/myendpoint' in servlet with name 'grailsDispatcherServlet'.

So, I reverted back to the instructions above.

Limousin answered 1/4, 2016 at 14:2 Comment(0)
J
4

Did you see this article? It details the how to step by step and got me past my problem.

http://mrhaki.blogspot.com/2013/12/grails-goodness-debugging-app-in-forked.html

Joses answered 7/11, 2014 at 20:59 Comment(0)
B
4

This is a very simple matter with Grails 3 and Idea (2016.1). There's no need to edit any files anymore, as recommended in the other answers.

For some reason, the debug icon in the Idea toolbar is greyed out, so you just have to navigate to your application entry point (the class that has the static void main method that starts the application), click on one of the run arrows in the left-hand gutter and select the Debug option.

From the JetBrains docs:

https://www.jetbrains.com/help/idea/2016.1/getting-started-with-grails-3.html

Debugging Grails 3 Application

IntelliJ IDEA lets you debug your Grails 3 application using Application.groovy.

In the Project tool window, open init directory and right-click the Application.groovy From the drop-down list select Debug Grails:'name' grails3_debug_app You can also use the editor to start the debugging process.

Battaglia answered 8/7, 2016 at 15:19 Comment(0)
A
1

Just three guesses:

Try running run-app, not run-war, both should work, but may be run-war just isn't working.

Or: try debugging remotely from console:

grails -debug run-app and then connect with Remote Debug in Idea.

Or, the last resort: downgrading your project to previous Grails versions could work. Yes, this is really annoying.

Hope this helps.

Argentite answered 9/10, 2013 at 8:41 Comment(0)
C
1

I tested with intellij latest with Grails 2.3.4 on Mac Os x Lion.

Then I tried Igors's advice and it is working without forked mode.

grails.project.fork = [
    test: false,
    run: false
]

Please check for detail grails documentation

if you want to debug forked mode you should check following blog post explainsvery well.

http://blog.jdriven.com/2013/12/grails-goodness-debugging-app-forked-mode/

Carlstrom answered 3/1, 2014 at 13:11 Comment(0)
P
0

This should not ever be the default configuration and only be left to the individual's choice. It's a freakin pain to do two configurations just get this thing running in debug mode in intellij. First you have to setup or modify the normal run configuration by adding "--debug-fork" after run-app. Second, you have to configure remote debugging , while accepting all the defaults. Then you have to run the run configuration, and when that's running, you run the debug configuration. What a pain. I prefer totally doing away with running without the forked option while developing. Time is money and I don't have time to monkey around. See Mr.HAKI explanation on doing this. http://blog.jdriven.com/2013/12/grails-goodness-debugging-app-forked-mode/

Popelka answered 4/2, 2014 at 1:23 Comment(3)
I think the answer would be more useful if you first gave the answer, then your commentary on why it is annoying. Perhaps leaving off most of the commentary as well.Bunyabunya
No problem ... see my edited entry above: blog.jdriven.com/2013/12/… good luck.Popelka
Here is an update. I don't seem to be having this problem any more, but if it's not as important to you, I commented out portions of of the BuildConfig.groovy file under the conf directory that deals forking the JVM for optimizing memory when grails is running. //uncomment (and adjust settings) to fork the JVM to isolate //classpaths //grails.project.fork = [ // run: [maxMemory:1024, minMemory:64, debug:false, maxPerm:256] //]Popelka
G
0

1.terminal --> command : run-app --debug-jvm

console output: grails> run-app --debug-jvm | Running application... Listening for transport dt_socket at address: 5005

NOTE: Change/Update port as per your client system

  1. add debugger [ shoud be on port 5005 as default ] , "Remote JVM Debug", add new [ Intelli J setting ]

3.Once done , new debugger will be set [ step 2 ], run the the webapp on debug mode.

console output: Connected to the target VM, address: 'localhost:5005', transport: 'socket'

  1. Grails[intellij] has tomcat embedded at 8080, so hit "localhost:8080" and click on the controller [ where you added the toggele point ]

5.configuration is now connected - go ahead and explore your debugging skills to fix the issue :) :)

Germanic answered 25/3, 2021 at 17:38 Comment(1)
Use the formatting options available in Stackoverflow editor when posting an answer or a problem.Tracheitis

© 2022 - 2024 — McMap. All rights reserved.