Visual Studio 2017 Debug Error: To prevent an unsafe abort when evaluating the function *.toString all threads were allowed to run
Asked Answered
T

3

42

I updated Visual Studio 2017 to version 15.8.2.

After this update, I started to encounter these errors while debugging:

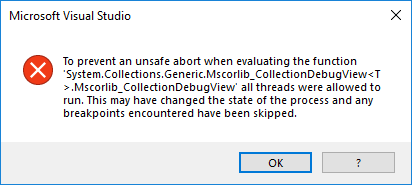
Error Image 1

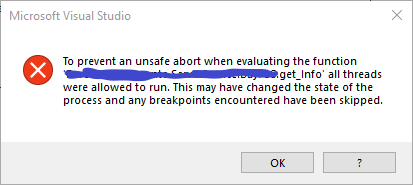
Error Image 2

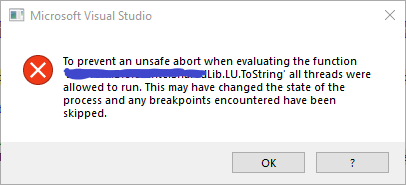
Error Image 3

Here are the error messages:

Visual Studio Debug Error: To prevent an unsafe abort when evaluating the function *.toString all threads were allowed to run. This may have changed the state of the process and any breakpoints encountered have been skipped.

This error shows up quite often, and after a while Visual Studio crashes.

I tried to uninstall and install Visual Studio again and reset preferences, but I had no luck.

When I disable the option: "Enable property evaluation and other implicit function calls", I get the same error when I try to evaluate some properties by moving the mouse over them. It's quite difficult to debug without it, and I had no problems before this build.

The problem is the same with C# and Visual Basic (.NET).

Is there any fix for this problem? My team has no problem working on the same project with Visual Studio 2017 version 15.7.4

Terpsichore answered 5/9, 2018 at 14:17 Comment(0)
J
33

I add the same error message but with a different function name :

To prevent an unsafe abort when evaluating the function 'Microsoft.VisualStudio.Debugger.Runtime.Tracing.Refresh' all threads were allowed to run. This may have changed the state of the process and any breakpoints encountered have been skipped.


This is how I got rid of this pesky bug :
In Visual Studio 2017 go to
Tools → Options → Debugging → General → Check 'Use Managed Compatibility Mode'
thanks to this article :
https://www.codeart.dk/blog/2018/9/vs2017-debugger-timeout/

Jannjanna answered 30/10, 2018 at 9:0 Comment(8)
According to Microsoft learn.microsoft.com/en-us/visualstudio/debugger/…, checking this option means "switching to the legacy debugging engine". This probably means that we are losing some new debugging features. I'd like to know, what we are losing.Mechanician
For me, enabling this, causes the evaluation of the function to timeout.Lovellalovelock
@AlexFainshteinOne thing you will lose is lambda expression evaluation in watch and quickwatchReshape
I wouldn't call this an answer, because it is a workaround. Using this option may stop loading your PDB files correctly making debugging impossible.Exarch
You also lose the timings tooltip that shows how much time has passed since the previous execution stop (breakpoint or previous statement).Dudley
there iS no such menu in VS 2019!!Reformer
I can confirm that this is working for VS Pro 2019 Version 16.6.2Ripplet
You lose Edit&Continue!!! that's not my solutionAmetropia
W
2

Visual Studio 2017 Debug Error: To prevent an unsafe abort when evaluating the function *.toString all threads where allowed to run

According to this document:

One common reason for this problem is that when the debugger evaluates a property, it only allows the thread being inspected to execute. So if the property is waiting on other threads to run inside the debugged application, and if it is waiting in a way that the .NET Runtime isn't able to interrupt, this problem will happen.

And to resolve this issue, you can try following two possible solutions:

  • Solution #1: Prevent the debugger from calling the getter property or
  • Solution #2: Have the target code ask the debugger to abort the evaluation ToString method

Besides, if above not resolve that error, you can also install the previous old version Visual Studio to check if it works for you:

https://learn.microsoft.com/en-us/visualstudio/productinfo/installing-an-earlier-release-of-vs2017#top

Hope this helps.

Woden answered 6/9, 2018 at 3:30 Comment(3)
Hi Leo, i already tried the solutions 1 and 2 ( see my post ). Every class debug was working into the last build. Is there any IDE cache that can be deleted ?Terpsichore
@SorinGeorgeBudescu, what do you mean "Is there any IDE cache that can be deleted ?" Do you want to delete the VS cache? If yes, please check: matteopozzani.com/visual-studio-cache-cleanupWoden
@Leo Liu-MSFT This is killing me in VS2019, and I never ran into it in previous versions. How do you perform solution #1 or #2 above?Mastership
T
0

In my case, the issue was related to a variable containing a LINQ query that was being evaluated within the Watch window during debugging.

For example, consider the following code snippet:

var result = query.Where(x => x.Id < 1000).ToList();

Sometimes, the error could be caused by the interaction between debugging and the Watch window's evaluation of expressions. By clearing the Watch window, you may be able to prevent the error from occurring.

Therapsid answered 8/8, 2023 at 15:32 Comment(0)

© 2022 - 2025 — McMap. All rights reserved.