How to effectively debug minified JS files?
Asked Answered
C

9

42

I've got problem debugging minified JS on production server.

While you can't catch some errors on your machine while testing dev/prod servers, there's an opportunity to send some frontend errors and exceptions from users to a special log.

When JS files are minified, debugging this code becomes a hell.
What are the best practices in performing such work?

Constructivism answered 14/7, 2016 at 13:39 Comment(6)
@TopCoder,@Mettin Parzinski,@Patrick DiGiovanni, yeah, beautifying helps sometimes, but unfortunately not always. So when I get error from user I see just some letters, that can be repeating in code several times, so it's hard to understand which of them error really refers toConstructivism
even source-maps can hardly help (only if I catch error myself)Constructivism
I edited my answer, does this help?Muck
Please mark my answer as accepted if it helped you =)Muck
competa.com/blog/…Candace
Now Chrome has a "pretty print" function. Auto I believe. Or if not just click {} in F12 mode...Telemeter
C
12

So, after some time, we've continued to try and resolve damn trouble and we've stumbled upon this library that allows you to map your stack to unminified version of build.

https://github.com/mozilla/source-map

We needed this to embed to our internal system that collects error reports. There are also ready solutions across the web if don't need your own like we do:

https://raygun.com/sourcemaps

https://sourcemaps.info/

Constructivism answered 24/4, 2017 at 15:0 Comment(1)
I haven't tried it yet but a similar tool that looks promising is source-map-cli.Comeon
M
59

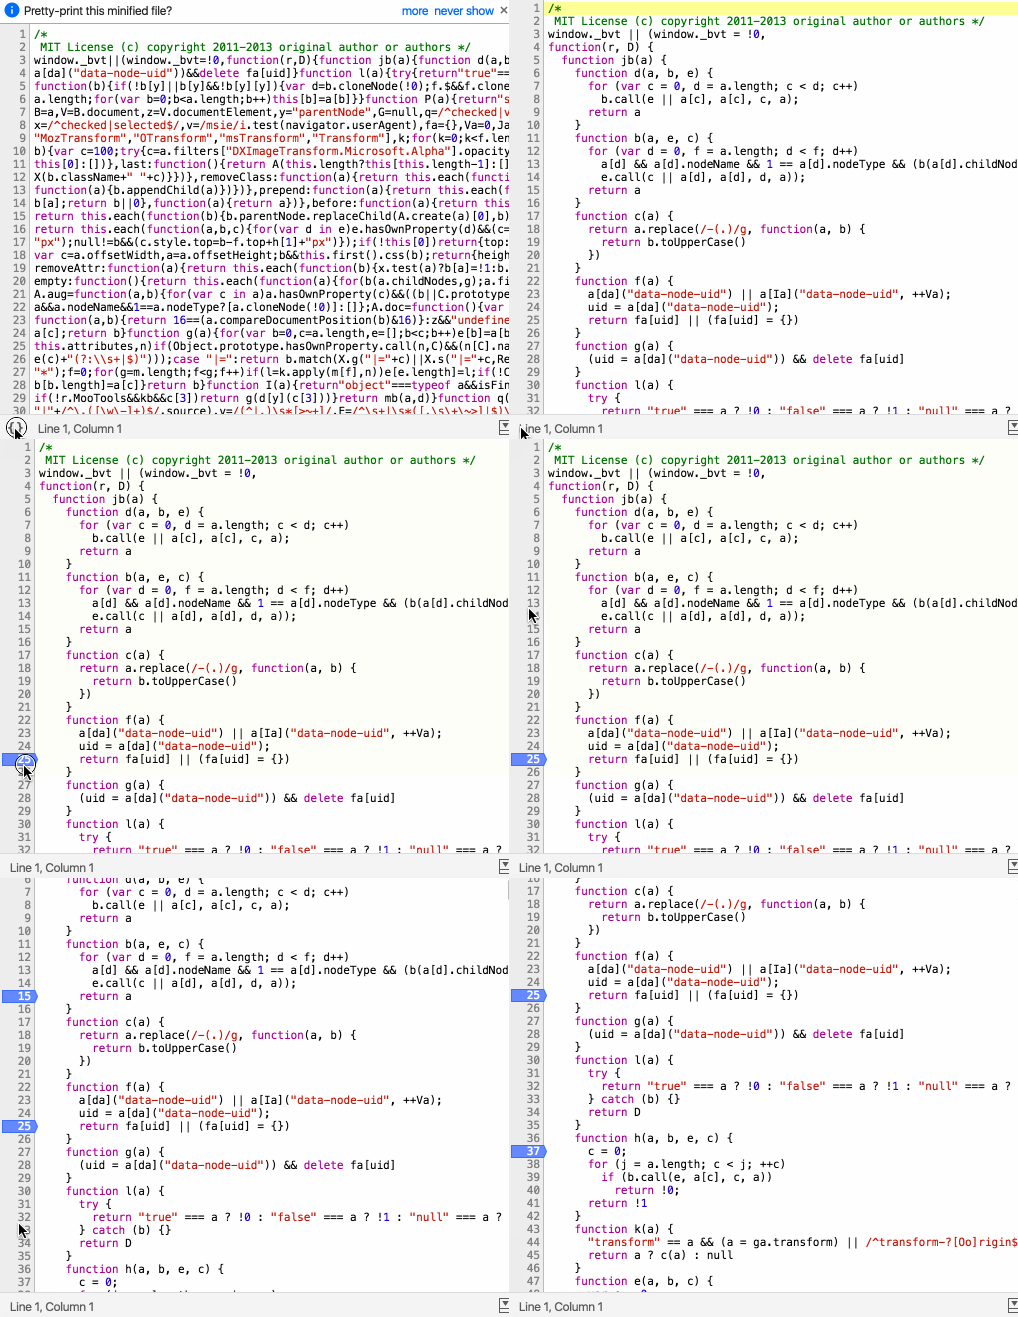
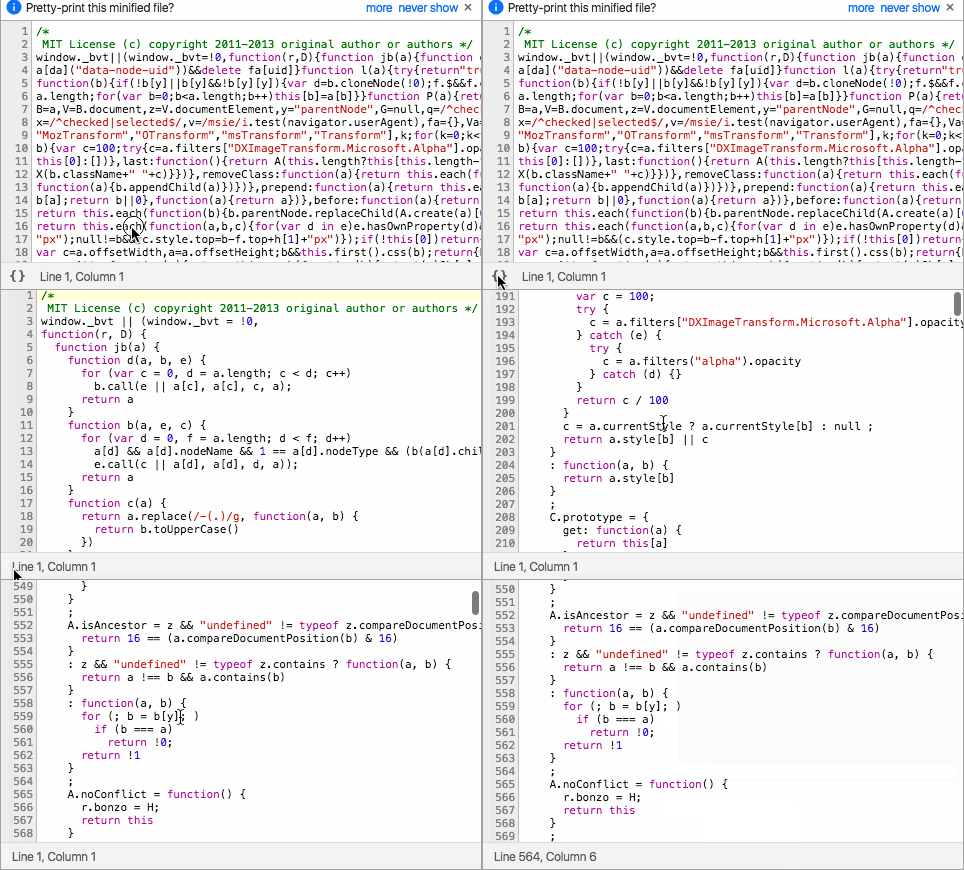
Biting the bullet ;) In chrome you can auto format the minified code from the sources panel click the brackets icon in the bottom left to format

Then you can add debugger statements by clicking the line numbers. Run your code and find out more...

add debugger by clicking line number

Muck answered 14/7, 2016 at 13:46 Comment(2)
In large webapps/websites, where webpack builds a bundle-file and the code you wish to debug is a 3rd-party module, it is impossible to place a break point, Chrome "refuses" for some reason, and places it on the first line regardless of what line the breakpoint was placed at.Melisenda
Trying to add a breakpoint to the line fails, as all pretty-printed lines end up being treated as one line.Brogan
C
12

So, after some time, we've continued to try and resolve damn trouble and we've stumbled upon this library that allows you to map your stack to unminified version of build.

https://github.com/mozilla/source-map

We needed this to embed to our internal system that collects error reports. There are also ready solutions across the web if don't need your own like we do:

https://raygun.com/sourcemaps

https://sourcemaps.info/

Constructivism answered 24/4, 2017 at 15:0 Comment(1)
I haven't tried it yet but a similar tool that looks promising is source-map-cli.Comeon
B
5

One approach you can try is a reverse proxy.

The Chrome prettify feature is OK but I found the proxy approach more stable (you don't have to keep pressing that pesky {} button) and it will work on every browser (like those that don't have Chrome's prettify feature).

The proxy sits between your browser and the web server (which could be running on a remote server or your local machine). All the web requests go through the proxy except those you configure to serve from a different location. In this case you would serve an un-minified version of the JavaScript file from a local location rather than the remote minified version. I've used nginx reverse proxy for this (on Windows) but expect others could be used in similar fashion (e.g. HA Proxy).

Example steps and configuration below:

Configure your nginx\conf\nginx.conf file something like this, the important parts are the location alias (to intercept the JavaScript file request) and the location proxy_pass (to forward all other requests to the upstream server):

worker_processes  1;
events {
    worker_connections  1024;
}
http {
    include       mime.types;
    default_type  application/octet-stream;
    sendfile      on;
    keepalive_timeout  65;
    server {
        listen       8081;
        server_name  localhost;
        # the unminified version of the JavaScript file you want to debug
        location /context/js/compressed.js {
            alias "C:/dev/nginx-1.10.2/html/uncompressed.js";
        }
        # your remote web server
        location / {
            proxy_pass http://1.2.3.4:8080/;
        }
        error_page   500 502 503 504  /50x.html;
        location = /50x.html {
            root   html;
        }
    }
}

Start nginx

open a command window (run cmd.exe)
cd\
cd C:\dev\nginx-1.10.2
start nginx

Open browser e.g. http://localhost:8081/context/index.html

The proxy fetches all resources from the remote server except the file requested from http://localhost:8081/context/js/compressed.js which the proxy now serves from the locally cached (unminified) file (i.e. the file uncompressed.js).

If you don't have one, you can create your uncompressed.js easily with an un-minifier / beautifier (though the original pre-compressed file would be besst as it would have all the meaningful names). The important thing is it's functionally equivalent to the minified file.

Backer answered 23/3, 2017 at 9:16 Comment(3)
that's an intersting idea, though in most cases if catch the error ourselves we can understand what happened even with minified code. the problem is that we're getting automatic error reports from from our users and it's hard to find exact place where it occured. so thank you for the idea, but this won't help(Constructivism
by "automatic error reports" meaning errors thrown by the browser in response to an exception not caught in your code? If you want a global (catch all) exception handler this answer could help https://mcmap.net/q/391682/-add-global-try-catch-to-javascriptBacker
yep, we're catching 'em, but catching is not a problem) there's difficulty in identifying exact error location. And what's up to global catching, there's some strange issue with catching exceptions from code built with requireJs (for we still use it unfortunately( ). It seems that requireJs swallows some of the exceptions so we can't catch all of them globallyConstructivism
D
4

What most people normally do is they have a javascript.min.js and a javascript.js. If you have a file that is minimized you can use an online tool like: http://unminify.com/ to un-minify it. So you can debug it easier.

Dustcloth answered 14/7, 2016 at 13:45 Comment(0)
H
0

You can't fully "un-minify" it but you can "beautify" it, which will not restore the original variable names, but it will at least make the code easier to follow. Here's a good explanation of how that can be done in the browser. And here's a website where you can copy and paste code to beautify it. There are also plugins for almost every text editor and IDE which will accomplish the same results.

I hope that helps. Happy coding!

Heartbreaking answered 14/7, 2016 at 13:45 Comment(0)
B
0

You can unminify js codes by using this Unminify Js. Also you can use CSS Unminify for unminify css codes or you need to unminify all html , use HTML Unminifier.

Sure, you can simply identify the bugs after unminify the javascript code by using this site.

Birr answered 9/9, 2019 at 13:4 Comment(0)
G
0

In case it's a Wordpress website, there is the SCRIPT_DEBUG constant that you can set in wp-config.php to true.

define( 'SCRIPT_DEBUG', true );

SCRIPT_DEBUG is a related constant that will force WordPress to use the “dev” versions of scripts and stylesheets in wp-includes/js, wp-includes/css, wp-admin/js, and wp-admin/css will be loaded instead of the .min.css and .min.js versions.

Garget answered 6/7, 2020 at 16:5 Comment(0)
C
0

Since the question seems pretty actual for many people, I would like to mention that we've started to use Sentry to work with client-side errors. It's capable of fetching your source-map files (or you can upload them manually or automatically via API) and displaying actual source code which invoked exceptions. It doesn't work flawlessly, but it's pretty helpful in most cases.

Constructivism answered 1/6, 2021 at 8:29 Comment(0)
M
-1

Prettyifying minified version in Chrome is good and will help in reading but variable names will still cause you trouble.

A better approach is to make a build locally with minify set to false in your config file, run it in your browser, it will then give you more readable variable names.

Example vite config:

import { defineConfig } from 'vite';

export default defineConfig({
  build: {
    minify: false,
  },
})
Matherly answered 21/12, 2022 at 10:57 Comment(1)
The question: "I've got problem debugging minified JS on production server.". This answer, basically: "just don't minify it lol". I mean- sure- valid (I guess?), but for some reason I kind of feel like it misses the point of the question.Pep

© 2022 - 2025 — McMap. All rights reserved.