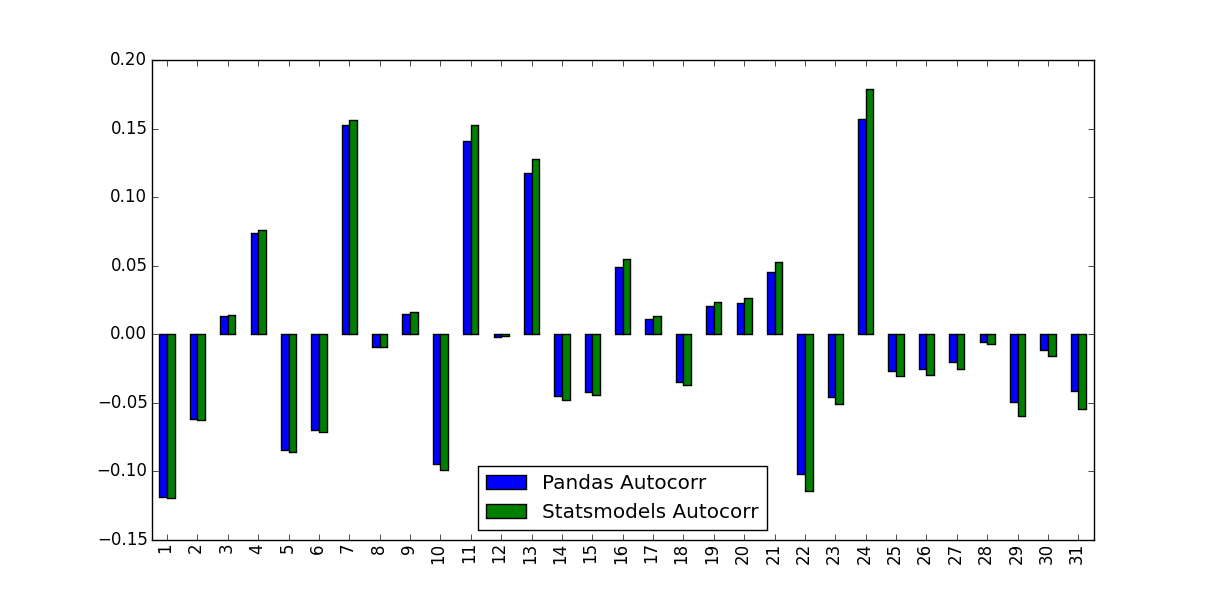
I'm calculating the Autocorrelation Function for a stock's returns. To do so I tested two functions, the autocorr function built into Pandas, and the acf function supplied by statsmodels.tsa. This is done in the following MWE:
import pandas as pd
from pandas_datareader import data
import matplotlib.pyplot as plt
import datetime
from dateutil.relativedelta import relativedelta
from statsmodels.tsa.stattools import acf, pacf

ticker = 'AAPL'
time_ago = datetime.datetime.today().date() - relativedelta(months = 6)

ticker_data = data.get_data_yahoo(ticker, time_ago)['Adj Close'].pct_change().dropna()
ticker_data_len = len(ticker_data)

ticker_data_acf_1 =  acf(ticker_data)[1:32]
ticker_data_acf_2 = [ticker_data.autocorr(i) for i in range(1,32)]

test_df = pd.DataFrame([ticker_data_acf_1, ticker_data_acf_2]).T
test_df.columns = ['Pandas Autocorr', 'Statsmodels Autocorr']
test_df.index += 1
test_df.plot(kind='bar')
What I noticed was the values they predicted weren't identical:
What accounts for this difference, and which values should be used?


1for the pandas version and40for statsmodel – Kraemerunbiased=Trueas option to the statsmodels version. – Kelseyunbiased=Trueshould make the autocorrelation coefficients larger. – Kelseyautocorrfrompandasis callingnumpy.corrcoefwhileacffromstatsmodelsis callingnumpy.correlate. I think digging in those can help to find the root of the differences in the outputs. – Vries