sorting points to form a continuous line
Asked Answered
S

6

43

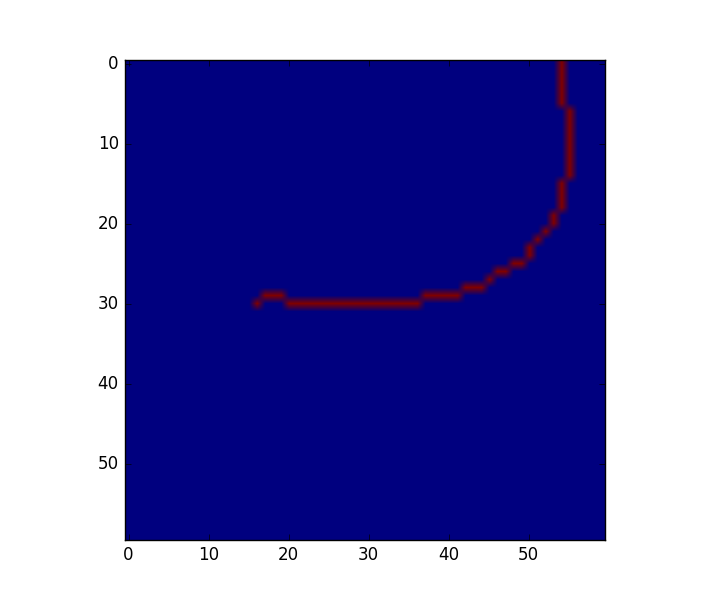
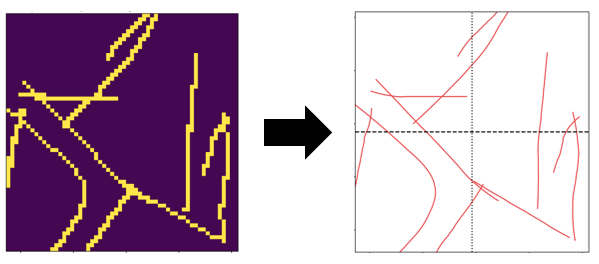
I have a list of (x,y)-coordinates that represent a line skeleton. The list is obtained directly from a binary image:

import numpy as np    
list=np.where(img_skeleton>0)

Now the points in the list are sorted according to their position in the image along one of the axes.

I would like to sort the list such that the order represents a smooth path along the line. (This is currently not the case where the line curves back). Subsequently, I want to fit a spline to these points.

A similar problem has been described and solved using arcPy here. Is there a convenient way to achieve this using python, numpy, scipy, openCV (or another library?)

below is an example image. it results in a list of 59 (x,y)-coordinates. enter image description here

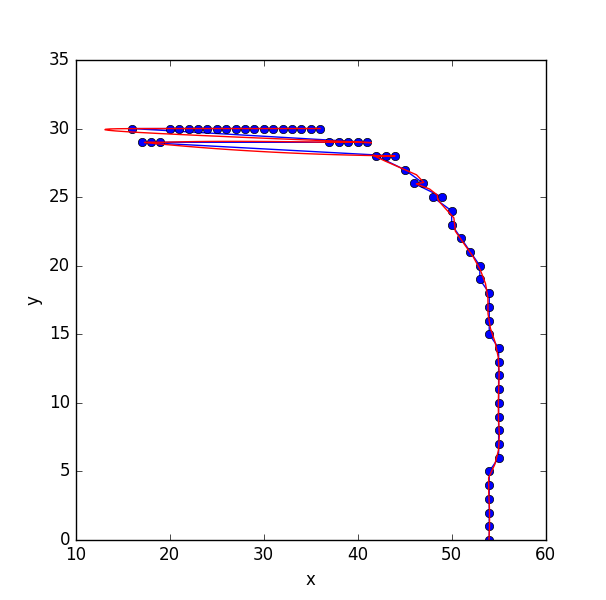
when I send the list to scipy's spline fitting routine, I am running into a problem because the points aren't 'ordered' on the line:

enter image description here

Stevenage answered 10/6, 2016 at 7:27 Comment(11)
You probably want to store vectors in order and keep a starting point instead? Would that be possible?Dissolvent
can you clarify what you mean by that and how I would go about it? Ultimately, all I care about is beeing able to fit a spline through the non-zero pixels in the skeleton image.Stevenage
Well I've thought about it some more and maybe it's not possible, because sorting a direction (vector or angle) would also be messed up once sorted as they have no chronological order. I just got a wild idea, some times they pan out.. Usually they don't hehe. I'm used to working with graphics but never really needed the feature you're looking for so I'm of no use here :)Dissolvent
You are provably looking at a "sort by nearest neighbor" function tho, that's a good search term :)Dissolvent
https://mcmap.net/q/390859/-python-nearest-neighbour-or-closest-match-filtering-on-data-records-list-of-tuples/929999Dissolvent
It doesn't look like a sorting problem. Are you looking for the shortest path that connects each node exactly once? You might look into Euclidian Travelling salesman problem.Traprock
I want to fit a spline through the red curve. I thought a good Idea would be to skeletonize and then feed the points on the skeleton to a spline fitting algorithm as described here: scipy.github.io/old-wiki/pages/Cookbook/…Stevenage
This problem is equivalent to finding the shortest path in a graph, where the graph is created as a fully connected graph (where your points are nodes) and edges are weighted by the euclidean distances between points.Tumpline
None of the answers below address the actual problem here, which is the way that points are extracted from the image. It is fairly simple to extract the points in the right order, leading to a much more efficient algorithm than any of the solutions below.Lounging
What would be a starting point to achieve that?Stevenage
You can try opencv findContours function, it produces a sorted list of points. I am using it for the boundary of an image. Your problem is simpler than the generic case (to construct maximal exterior polygon from unsorted points). If your contours are simple (without branches) it should work.Strawn
T
42

I apologize for the long answer in advance :P (the problem is not that simple).

Lets start by rewording the problem. Finding a line that connects all the points, can be reformulated as a shortest path problem in a graph, where (1) the graph nodes are the points in the space, (2) each node is connected to its 2 nearest neighbors, and (3) the shortest path passes through each of the nodes only once. That last constrain is a very important (and quite hard one to optimize). Essentially, the problem is to find a permutation of length N, where the permutation refers to the order of each of the nodes (N is the total number of nodes) in the path.

Finding all the possible permutations and evaluating their cost is too expensive (there are N! permutations if I'm not wrong, which is too big for problems). Bellow I propose an approach that finds the N best permutations (the optimal permutation for each of the N points) and then find the permutation (from those N) that minimizes the error/cost.

1. Create a random problem with unordered points

Now, lets start to create a sample problem:

import matplotlib.pyplot as plt
import numpy as np

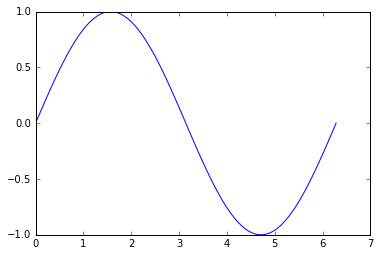
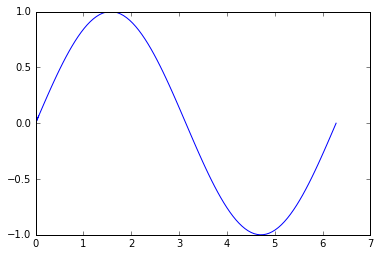
x = np.linspace(0, 2 * np.pi, 100)
y = np.sin(x)

plt.plot(x, y)
plt.show()

enter image description here

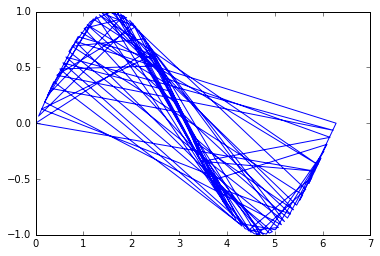
And here, the unsorted version of the points [x, y] to simulate a random points in space connected in a line:

idx = np.random.permutation(x.size)
x = x[idx]
y = y[idx]

plt.plot(x, y)
plt.show()

enter image description here

The problem is then to order those points to recover their original order so that the line is plotted properly.

2. Create 2-NN graph between nodes

We can first rearrange the points in a [N, 2] array:

points = np.c_[x, y]

Then, we can start by creating a nearest neighbour graph to connect each of the nodes to its 2 nearest neighbors:

from sklearn.neighbors import NearestNeighbors

clf = NearestNeighbors(2).fit(points)
G = clf.kneighbors_graph()

G is a sparse N x N matrix, where each row represents a node, and the non-zero elements of the columns the euclidean distance to those points.

We can then use networkx to construct a graph from this sparse matrix:

import networkx as nx

T = nx.from_scipy_sparse_matrix(G)

3. Find shortest path from source

And, here begins the magic: we can extract the paths using dfs_preorder_nodes, which will essentially create a path through all the nodes (passing through each of them exactly once) given a starting node (if not given, the 0 node will be selected).

order = list(nx.dfs_preorder_nodes(T, 0))

xx = x[order]
yy = y[order]

plt.plot(xx, yy)
plt.show()

enter image description here

Well, is not too bad, but we can notice that the reconstruction is not optimal. This is because the point 0 in the unordered list lays in the middle of the line, that is way it first goes in one direction, and then comes back and finishes in the other direction.

4. Find the path with smallest cost from all sources

So, in order to obtain the optimal order, we can just get the best order for all the nodes:

paths = [list(nx.dfs_preorder_nodes(T, i)) for i in range(len(points))]

Now that we have the optimal path starting from each of the N = 100 nodes, we can discard them and find the one that minimizes the distances between the connections (optimization problem):

mindist = np.inf
minidx = 0

for i in range(len(points)):
    p = paths[i]           # order of nodes
    ordered = points[p]    # ordered nodes
    # find cost of that order by the sum of euclidean distances between points (i) and (i+1)
    cost = (((ordered[:-1] - ordered[1:])**2).sum(1)).sum()
    if cost < mindist:
        mindist = cost
        minidx = i

The points are ordered for each of the optimal paths, and then a cost is computed (by calculating the euclidean distance between all pairs of points i and i+1). If the path starts at the start or end point, it will have the smallest cost as all the nodes will be consecutive. On the other hand, if the path starts at a node that lies in the middle of the line, the cost will be very high at some point, as it will need to travel from the end (or beginning) of the line to the initial position to explore the other direction. The path that minimizes that cost, is the path starting in an optimal point.

opt_order = paths[minidx]

Now, we can reconstruct the order properly:

xx = x[opt_order]
yy = y[opt_order]

plt.plot(xx, yy)
plt.show()

enter image description here

Tumpline answered 10/6, 2016 at 9:21 Comment(13)
looks cool. I like the strategy but I am getting an error on 'G = clf.kneighbors_graph()'. error: TypeError: kneighbors_graph() takes at least 2 arguments (1 given).Stevenage
@Stevenage which version of scikit-learn are you using? Because in the last version the parameters are optional. If not, try providing clf.kneighbors_graph(points, 2) or upgrading scikits-learn to the latest version.Tumpline
@Stevenage I did edit the post to add headings to make it more clear. Essentially, if you already know either the start or end node, the section 3. gives you a 1-line solution using nx.dfs_preorder_nodes(T, start_index). If you don't know (or don't want to provide manually) the initial node, section 4. computes all the possible minimum paths with each of the nodes as source, and filters the one with minimum cost.Tumpline
I wasn't talking about the clf.kneibors_graph command. I mentioned the line after that. what should be the arguments there?Stevenage
@Stevenage the error you are reporting "G = clf.kneighbors_graph()". error: TypeError: kneighbors_graph() takes at least 2 arguments (1 given) indicates that the G = clf.kneighbors_graph() is the line doing wrong :S Try replacing it by G = clf.kneighbors_graph(points, 2).Tumpline
This line paths = [list(nx.dfs_preorder_nodes(T, i)) for i in range(len(points))] is generating paths of smaller size than len(points) in some cases, resulting in a wrong sorting. Why is this?Nessie
Is it possible to find the end point/node by querying the degrees of T, like endidx=np.where(T.degree().values()==1)? The end points should in general have degree of 1, unless the line is not quite straight at both ends.Agriculturist
I just realized that there aren't any degree 1 nodes, because the number of neighbors is 2 by design. Also, I think there is some problem regarding the optimization method. I found this relavent question: https://mcmap.net/q/390860/-sort-points-in-order-to-have-a-continuous-curve-using-python/2005415, using your method, the minidx is 8, and it doesn't even get the full path, but just the tip of it so the cost gets quite small.Agriculturist
I think that happens because her data is too unevenly distributed, where there is a big gap in the line, the 2 nearest neighbors found by sklearn package lie on the same, rather than both sides of the gap, so the line is broken into 2 parts, that's why the resultant graph consists of 2 lines (one with length 44 and the other 6). I kinda feel that her solution is more robust, which is similar to a region-grow, but in this case, a line grow search.Agriculturist
I have an issue that is very close to this, but where there might be discontinuity, ie the tree should divide in subtree (not only one path) any idea how to do it efficiently?Velour
This method is not robust for noisy data. It fails in graph construction stage.Melson
Thank you so much for pointing me in the right direction. Indeed the performance is not great for noisy data, but it worked well enough for my use caseHawthorn
For the newer versions of sklearn and networkx, clf = NearestNeighbors(n_neighbors=2).fit(points) and T = nx.from_scipy_sparse_array(G) works for me.Unimproved
D
7

One possible solution is to use a nearest neighbours approach, possible by using a KDTree. Scikit-learn has an nice interface. This can then be used to build a graph representation using networkx. This will only really work if the line to be drawn should go through the nearest neighbours:

from sklearn.neighbors import KDTree
import numpy as np
import networkx as nx

G = nx.Graph()  # A graph to hold the nearest neighbours

X = [(0, 1), (1, 1), (3, 2), (5, 4)]  # Some list of points in 2D
tree = KDTree(X, leaf_size=2, metric='euclidean')  # Create a distance tree

# Now loop over your points and find the two nearest neighbours
# If the first and last points are also the start and end points of the line you can use X[1:-1]
for p in X
    dist, ind = tree.query(p, k=3)
    print ind

    # ind Indexes represent nodes on a graph
    # Two nearest points are at indexes 1 and 2. 
    # Use these to form edges on graph
    # p is the current point in the list
    G.add_node(p)
    n1, l1 = X[ind[0][1]], dist[0][1]  # The next nearest point
    n2, l2 = X[ind[0][2]], dist[0][2]  # The following nearest point  
    G.add_edge(p, n1)
    G.add_edge(p, n2)


print G.edges()  # A list of all the connections between points
print nx.shortest_path(G, source=(0,1), target=(5,4))
>>> [(0, 1), (1, 1), (3, 2), (5, 4)]  # A list of ordered points

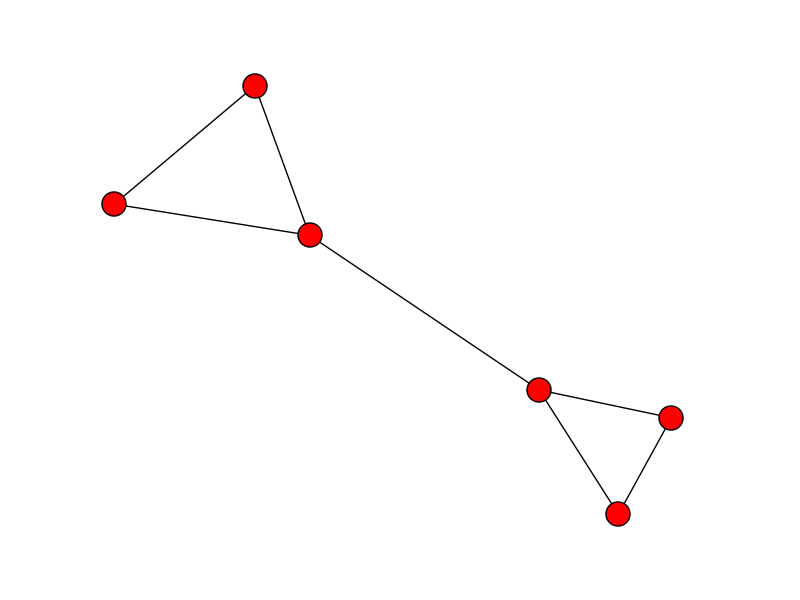
Update: If the start and end points are unknown and your data is reasonably well separated, you can find the ends by looking for cliques in the graph. The start and end points will form a clique. If the longest edge is removed from the clique it will create a free end in the graph which can be used as a start and end point. For example, the start and end points in this list appear in the middle:

X = [(0, 1), (0, 0), (2, 1),  (3, 2),  (9, 4), (5, 4)]

enter image description here

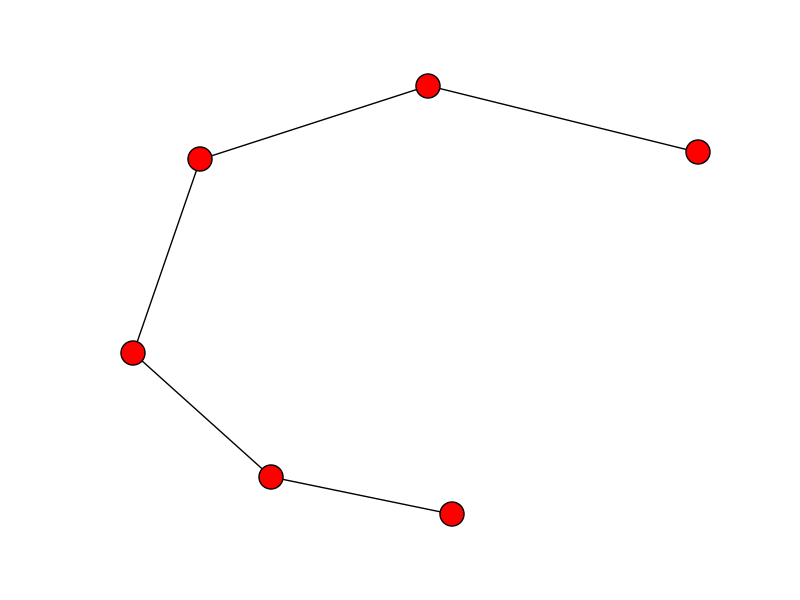
After building the graph, now its a case of removing the longest edge from the cliques to find the free ends of the graph:

def find_longest_edge(l):
    e1 = G[l[0]][l[1]]['weight']
    e2 = G[l[0]][l[2]]['weight']
    e3 = G[l[1]][l[2]]['weight']
    if e2 < e1 > e3:
        return (l[0], l[1])
    elif e1 < e2 > e3:
        return (l[0], l[2])
    elif e1 < e3 > e2:
    return (l[1], l[2])

end_cliques = [i for i in list(nx.find_cliques(G)) if len(i) == 3]
edge_lengths = [find_longest_edge(i) for i in end_cliques]
G.remove_edges_from(edge_lengths)
edges = G.edges()

enter image description here

start_end = [n for n,nbrs in G.adjacency_iter() if len(nbrs.keys()) == 1]
print nx.shortest_path(G, source=start_end[0], target=start_end[1])
>>> [(0, 0), (0, 1), (2, 1), (3, 2), (5, 4), (9, 4)]  # The correct path
Dianthus answered 10/6, 2016 at 8:27 Comment(11)
You could essentially use sklearn's NearestNeighbors and its function .kneighbors_graph(), which would instantly give you a sparse representation of a graph (which is more clear and faster than using networkx to construct one). Anyway, after you have the graph of 2 nearest neighbors, you still have to order them, the problem is not yet solved.Tumpline
I was going to say: now how am I sorting the list of graph edges? Perhaps there is a utility function in networkx that I am missing?Stevenage
I didnt know about kneighbour_graph(), thanks! You dont need to sort the edges to draw a line. Just draw a line between nodes which have an edge and you will have a line, all joined up. But there is probably also a function which gives you the path in networkx. Sorry im not that familiar with networkxDianthus
maybe I wasn't clear but the point is not to draw the line but to obtain a sorted list of coordinates that I can feed into a spline fitting algorithm. for that, the list must be sorted as far as I understand it.Stevenage
I recommend looking at .kneighbors_graph() as suggested by Imanol, or look at nx.shortes_path() function: print nx.shortest_path(G, source=(0,1), target=(5,4))Dianthus
The problem is that you don't always know which are the source and the target points. It is not trivial to detect them if the list is completely unordered in advance.Tumpline
shortest_path is doing the trick. For now I manually selected source and target. It should be possible to find the two pixels with only one neighbor in the binary skeleton image. there ought to be only two, that is the definition of the skeleton. Any ideas?Stevenage
@Stevenage find bellow my answer to automatically find those points. If the points are sampled at exactly the same distance, howecer, you could just pick the 2 points with larger distance to their 2 nearest neighbours, because, for the edge points the 2 closest ones will be further.Tumpline
If your points are reasonably well spaced and unordered, constructing a graph as above will lead to a clique being formed at either end of the line. It is then a case of removing the longest edge from this clique which will leave a node with only one adjacent edge. This can then from the start/end position for finding the path.Dianthus
why did you suggest skipping the first and last item for constructing the graph? # Now loop over your points and find the two nearest neighbours for p in X[1:-1]: # Skip first and last items in list ?? This causes problems for me - sometimes my graph is broken into two disconnected parts because of it. Using all items works fine for this part.Stevenage
Ah yes, you are right! I put that in the first time I answered because it makes sense when the first and last point are also the start and end points of your line. If the points are unordered this is not the case which explains why you get a broken line. You are right to remove this, thanks.Dianthus
E
5

I agree with Imanol_Luengo Imanol Luengo's solution, but if you know the index of the first point, then there is a considerably easier solution that uses only NumPy:

def order_points(points, ind):
    points_new = [ points.pop(ind) ]  # initialize a new list of points with the known first point
    pcurr      = points_new[-1]       # initialize the current point (as the known point)
    while len(points)>0:
        d      = np.linalg.norm(np.array(points) - np.array(pcurr), axis=1)  # distances between pcurr and all other remaining points
        ind    = d.argmin()                   # index of the closest point
        points_new.append( points.pop(ind) )  # append the closest point to points_new
        pcurr  = points_new[-1]               # update the current point
    return points_new

This approach appears to work well with the sine curve example, especially because it is easy to define the first point as either the leftmost or rightmost point.

For the img_skeleton data cited in the question, it would be similarly easy to algorithmically obtain the first point, for example as the topmost point.

# create sine curve:
x      = np.linspace(0, 2 * np.pi, 100)
y      = np.sin(x)

# shuffle the order of the x and y coordinates:
idx    = np.random.permutation(x.size)
xs,ys  = x[idx], y[idx]   # shuffled points

# find the leftmost point:
ind    = xs.argmin()

# assemble the x and y coordinates into a list of (x,y) tuples:
points = [(xx,yy)  for xx,yy in zip(xs,ys)]

# order the points based on the known first point:
points_new = order_points(points, ind)

# plot:
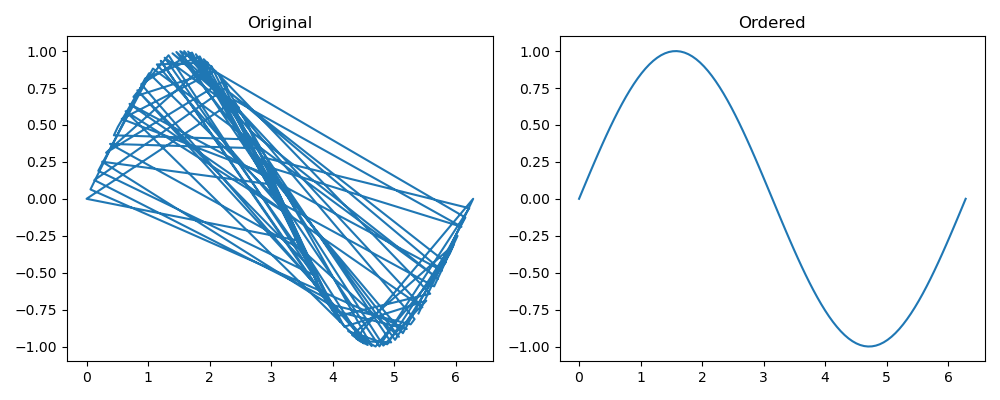
fig,ax = plt.subplots(1, 2, figsize=(10,4))
xn,yn  = np.array(points_new).T
ax[0].plot(xs, ys)  # original (shuffled) points
ax[1].plot(xn, yn)  # new (ordered) points
ax[0].set_title('Original')
ax[1].set_title('Ordered')
plt.tight_layout()
plt.show()

ordered_points

Evaporite answered 25/6, 2021 at 9:26 Comment(2)
Note that the left-most point may not always be an end-point. Consider a sine wave rotated 90 degrees -- i.e. we couldn't assume the "top-most" location was an end-point.Gadson
Agreed. This solution requires that the index of the first point is known. If you can find the first point algorithmically or manually, then this numpy-only solution seems simplest.Evaporite
P
4

I had the exact same problem. If you have two arrays of scattered x and y values that are not too curvy, then you can transform the points into PCA space, sort them in PCA space, and then transform them back. (I've also added in some bonus smoothing functionality).
enter image description here

import numpy as np
from scipy.signal import savgol_filter
from sklearn.decomposition import PCA

def XYclean(x,y): 

    xy = np.concatenate((x.reshape(-1,1), y.reshape(-1,1)), axis=1)     

    # make PCA object
    pca = PCA(2)
    # fit on data
    pca.fit(xy)
    
    #transform into pca space   
    xypca = pca.transform(xy) 
    newx = xypca[:,0]
    newy = xypca[:,1]

    #sort
    indexSort = np.argsort(x)
    newx = newx[indexSort]
    newy = newy[indexSort]

    #add some more points (optional)
    f = interpolate.interp1d(newx, newy, kind='linear')        
    newX=np.linspace(np.min(newx), np.max(newx), 100)
    newY = f(newX)            

    #smooth with a filter (optional)
    window = 43
    newY = savgol_filter(newY, window, 2)

    #return back to old coordinates
    xyclean = pca.inverse_transform(np.concatenate((newX.reshape(-1,1), newY.reshape(-1,1)), axis=1) )
    xc=xyclean[:,0]
    yc = xyclean[:,1]

    return xc, yc
Peel answered 12/8, 2020 at 0:36 Comment(0)
I
2

I am working on a similar problem, but it has an important constraint (much like the example given by the OP) which is that each pixel has either one or two neighboring pixel, in the 8-connected sense. With this constraint, there is a very simple solution.

def sort_to_form_line(unsorted_list):
    """
    Given a list of neighboring points which forms a line, but in random order, 
    sort them to the correct order.
    IMPORTANT: Each point must be a neighbor (8-point sense) 
    to a least one other point!
    """
    sorted_list = [unsorted_list.pop(0)]

    while len(unsorted_list) > 0:
        i = 0
        while i < len(unsorted_list):
            if are_neighbours(sorted_list[0], unsorted_list[i]):
                #neighbours at front of list
                sorted_list.insert(0, unsorted_list.pop(i))
            elif are_neighbours(sorted_list[-1], unsorted_list[i]):
                #neighbours at rear of list
                sorted_list.append(unsorted_list.pop(i))
            else:
                i = i+1

    return sorted_list

def are_neighbours(pt1, pt2):
    """
    Check if pt1 and pt2 are neighbours, in the 8-point sense
    pt1 and pt2 has integer coordinates
    """
    return (np.abs(pt1[0]-pt2[0]) < 2) and (np.abs(pt1[1]-pt2[1]) < 2)
Indra answered 9/4, 2018 at 10:4 Comment(0)
L
0

Modifying upon Toddp's answer , you can find end-points of arbitrarily shaped lines using this code and then order the points as Toddp stated, this is much faster than Imanol Luengo's answer, the only constraint is that the line must have only 2 end-points :

def order_points(points):
  if isinstance(points,np.ndarray): 
    assert points.shape[1]==2
    points = points.tolist()

  exts = get_end_points(points)
  assert len(exts) ==2
  ind = points.index(exts[0])

  points_new = [ points.pop(ind) ]  # initialize a new list of points with the known first point
  pcurr      = points_new[-1]       # initialize the current point (as the known point)
  while len(points)>0:
      d      = np.linalg.norm(np.array(points) - np.array(pcurr), axis=1)  # distances between pcurr and all other remaining points
      ind    = d.argmin()                   # index of the closest point
      points_new.append( points.pop(ind) )  # append the closest point to points_new
      pcurr  = points_new[-1]               # update the current point
  return points_new

def get_end_points(ptsxy):
  #source : https://mcmap.net/q/390861/-finding-the-end-points-of-a-hand-drawn-line-with-opencv
  if isinstance(ptsxy,list): ptsxy = np.array(ptsxy)
  assert ptsxy.shape[1]==2
  #translate to (0,0)for faster excution

  xx,yy,w,h = cv2.boundingRect(ptsxy)
  pts_translated = ptsxy -(xx,yy)
  bim = np.zeros((h+1,w+1))
  bim[[*np.flip(pts_translated).T]]=255
  extremes = []    
  for p in pts_translated:
    x = p[0]
    y = p[1]
    n = 0        
    n += bim[y - 1,x]
    n += bim[y - 1,x - 1]
    n += bim[y - 1,x + 1]
    n += bim[y,x - 1]    
    n += bim[y,x + 1]    
    n += bim[y + 1,x]    
    n += bim[y + 1,x - 1]
    n += bim[y + 1,x + 1]
    n /= 255        
    if n == 1:
      extremes.append(p)
  extremes = np.array(extremes)+(xx,yy)
  return extremes.tolist()

Loyalty answered 7/9, 2022 at 19:33 Comment(0)

© 2022 - 2024 — McMap. All rights reserved.