How to make Chrome always launch with remote-debugging-port flag
Asked Answered
U

5

43

I know I can launch chrome the following way to open a remote debugging port at 9222 port -

chrome.exe --remote-debugging-port=9222

But I want to setup Chrome such that whenever it is launched by any other application, it always opens with the remote debugging option enabled. Will a custom profile work?

I want to achieve it as there a desktop app that would be launching chrome on clicking its button. I want to control that chrome session.

Untie answered 27/7, 2018 at 18:2 Comment(2)
while this is actually not a question for Stackoverflow, you can create a desktop shortcut on Windows and then go to properties of the shortcut/launcher (right-click on desktop shortcut and click properties) and edit the command. That shortcut can then be used to always open chrome with the flag. Alternatively you can wire a button handler on your desktop app to run the command for starting in debug mode.Hesperidin
Shortcut wont work as I would not be launching chrome. There a desktop app that would be launching chrome with a landing page on clicking its button. I want to control that chrome session. Also, I cannot wire the button handler as I am not the developer of that app nor I do have source code.Untie
U
16

I have figured out a way to solve my problem statement. I am posting it as an answer as it may help someone else with similar problem statements.

If you are on Windows, go to registry editor and search this command

Computer\HKEY_CLASSES_ROOT\ChromeHTML\shell\open\command

Modify the key with the following -

"C:\Program Files (x86)\Google\Chrome\Application\chrome.exe" --remote-debugging-port=9222 -- "%1"

If you want to play with Chrome, put --incognito if you always want to launch Chrome in incognito mode.

Caution: Please backup your registry before playing with it.

Untie answered 30/7, 2018 at 12:13 Comment(3)
However, for mac, I am still looking for a solution.Untie
Not working for me. Can you please help me?Apparitor
Not working for me either.Heighho
H
36

For mac, I made a simple application that launches chrome with the --remote-debugging-port for me. Mathias Bynens has a wonderful post on how to do this (which is where I got the idea). He even includes a (forked) script that can do most of it for you, but the basics are really simple.

  1. Make a directory in your applications folder with the following structure <new app name>/Contents/MacOS:

    mkdir -p /Applications/Chrome\ Debugger.app/Contents/MacOS
    
  2. Create your script file and make it executable (its name need to match the top folder name):

    cd /Applications/Chrome\ Debugger.app/Contents/MacOS
    touch Chrome\ Debugger
    chmod +x Chrome\ Debugger
    
  3. Edit the new file with your editor of choice (your path to chrome may be different):

    #!/usr/bin/env bash
    /Applications/Google\ Chrome.app/Contents/MacOS/Google\ Chrome --remote-debugging-port=9222&
    

And that's about it. You can add a custom icon if you want to make it easier to find (copy your new icon > right click the new app > Get Info > click the current icon in the top left > paste the new icon over current icon), but the app will work fine without it.

Hindrance answered 18/10, 2019 at 19:41 Comment(7)
Slight tweak: mkdir -p /Applications/Chrome\ Debugger.app/Contents/MacOS And thanks for the icon!Isley
When i attempt this, it "opening in existing browser session" and i can't access the port the debugger is listening on.Shelleyshellfire
You have an existing browser session. This won't create a new instance of Chrome, it just launches Chrome with the flag. If Chrome is already running, Mac will just reuse it instead. If you want the flag and Chrome is already running, you'll have to kill Chrome before you use this.Hindrance
What are the security implications of always enabling remote debugging?Preparedness
If you have an existing browser session and you run this, MacOS will just reuse it instead. One way to get the flag to work is to close all instances of chrome before running the script. However, a better way IMO, is to add a custom user-data-dir flag. Example /Applications/Google\ Chrome.app/Contents/MacOS/Google\ Chrome --remote-debugging-port=9222 --user-data-dir=path/to/custom/folder&Aerobiology
I'll have to try that. I right now, I just always use the debug version and never launch chrome normally. Having the option not to do that would be nice.Hindrance
Just made his comment into a script (Edge version) mkdir -p Microsoft\ Edge\ Debugger.app/Contents/MacOS echo '#!/usr/bin/env bash \n/Applications/Google\ Chrome.app/Contents/MacOS/Google\ Chrome --remote-debugging-port=9222&' | cat > Microsoft\ Edge\ Debugger.app/Contents/MacOS/Microsoft\ Edge\ DebuggerHolifield
P
26

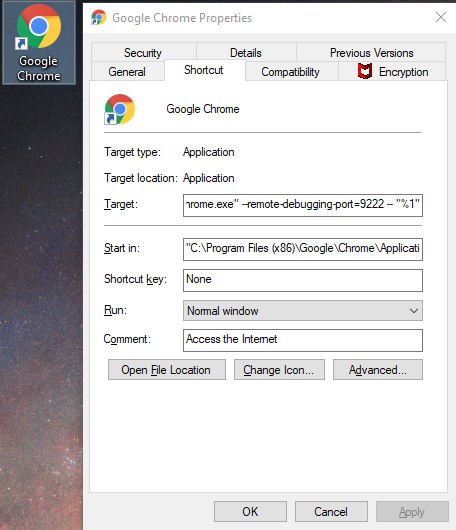
Rather than editing the registry, you can simply append the flag directly within the program properties by right clicking on the Chrome icon and adding...

--remote-debugging-port=9222 -- "%1" 

...onto the end of the target field.

enter image description here

Proportional answered 5/6, 2019 at 9:31 Comment(2)
What does the "%1" do? It seems to work without it.Barbiturism
@Barbiturism %1 is there if you drop a file on the shortcut or something, so that the shortcut knows what file its pointing to. Read more about it here: computerhope.com/jargon/num/percent1.htmCarter
U
16

I have figured out a way to solve my problem statement. I am posting it as an answer as it may help someone else with similar problem statements.

If you are on Windows, go to registry editor and search this command

Computer\HKEY_CLASSES_ROOT\ChromeHTML\shell\open\command

Modify the key with the following -

"C:\Program Files (x86)\Google\Chrome\Application\chrome.exe" --remote-debugging-port=9222 -- "%1"

If you want to play with Chrome, put --incognito if you always want to launch Chrome in incognito mode.

Caution: Please backup your registry before playing with it.

Untie answered 30/7, 2018 at 12:13 Comment(3)
However, for mac, I am still looking for a solution.Untie
Not working for me. Can you please help me?Apparitor
Not working for me either.Heighho
P
10

I can't add comments yet, But David Mann's answer is out of date for MacOS.

Thankfully only one slight change is needed; Add the bash shebang to the Chrome Debugger script.

#!/bin/bash
/Applications/Google\ Chrome.app/Contents/MacOS/Google\ Chrome --remote-debugging-port=9222&

this update for mac users was found here: Enable remote debugging on Chrome by default on mac?

Nat Khun also went to the trouble of crafting a .dmg to allow for a "normal" installation procedure for mac users. His repo can be found here: https://github.com/natkuhn/Chrome-debug/

be sure to give him a star. I did!

Performance answered 13/3, 2020 at 6:6 Comment(1)
Thanks, this is working for me!Isobaric
V
2

UPDATE: The original link is not available any more. However, the content is still accessible via Wayback Machine: https://web.archive.org/web/20190518020939/http://kynatro.com/blog/2018/01/11/chrome-debugging-in-vscode/


I'm using the solution by Dave Shepard using Automator to create a custom Chrome Debug App: Chrome Debugging in VSCode

I'm adding the necessary steps here:

  • Open Automator
  • Choose Application when it prompts you for what kind of automation you want to make
  • Find and choose Run Shell Script from the list of actions
  • Put your shell command to launch Chrome with the flag in the field: /Applications/Google\ Chrome.app/Contents/MacOS/Google\ Chrome --remote-debugging-port=9222
  • Save your automation somewhere with a convenient name you can reference (e.g. Google Chrome Debug Mode) I saved mine to ~/Applications so it would appear in my Alfred list.

That’s it! Just run the automation instead of Chrome directly. As mentioned, you will see two icons in your dock because the automation application isn’t Chrome. I just added my automation application to my dock and removed the normal Chrome entry. If you want the same icon as the normal Chrome shortcut:

  • Open Finder and navigate to /Applications Find Google Chrome in the list of applications and Get Info on it
  • Click the little Chrome icon in the upper left of the window (not the big one at the bottom) and hit cmd+c to copy it to the clipboard
  • Find your automation application and Get Info on it
  • Click the Automator icon in the upper lift and hit cmd+v to paste in the copied Chrome icon
Veracity answered 25/8, 2021 at 15:2 Comment(3)
your link is no longer availableIcehouse
Take a look here: web.archive.org/web/20190518020939/http://kynatro.com/blog/2018/…Veracity
maybe you could also update your link in your answer for easier accessIcehouse

© 2022 - 2024 — McMap. All rights reserved.