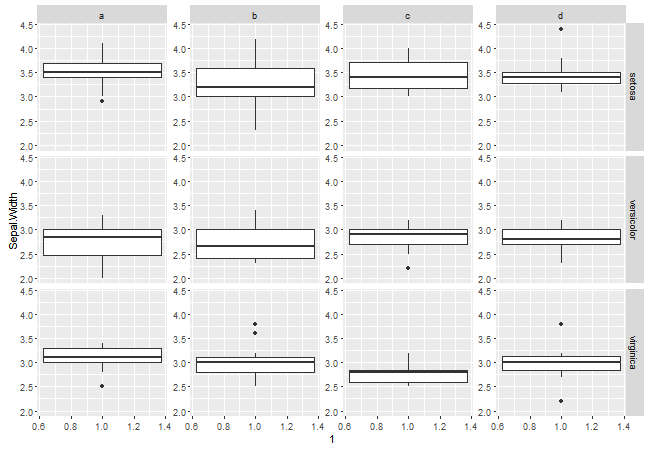
I can't get the answer to this question to work. What both me and that user want is to add axis ticks and labels to all columns when using facet_grid().
Display y-axis for each subplot when faceting
When I run the reproducable example and the solution (after adding abc=as.data.frame(abc) to fix the initial error) I receive an error message
Error in gtable_add_grob(g, grobs = list(segmentsGrob(1, 0, 1, 1), segmentsGrob(1, : Not all inputs have either length 1 or same length same as 'grobs
I made my own reproducible example because the original one is ehhm, a bit odd :-). It results in the same error message
require(ggplot2)
require(reshape)
require(grid)
require(gtable)
data(iris)
iris$category=rep(letters[1:4],length.out=150)
plot1=ggplot(data=iris,aes(x=1,y=Sepal.Width))+geom_boxplot()+facet_grid(Species~category)
The answer should be this:
g <- ggplotGrob(plot1)

require(gtable)
axis <- gtable_filter(g, "axis-l")[["grobs"]][[1]][["children"]][["axis"]][,2]
segment <- segmentsGrob(1,0,1,1)
panels <- subset(g$layout, name == "panel")
g <- gtable_add_grob(g, grobs=list(axis, axis), name="ticks",
                     t = unique(panels$t), l=tail(panels$l, -1)-1)

g <- gtable_add_grob(g, grobs=list(segmentsGrob(1,0,1,1),
                                   segmentsGrob(1,0,1,1)),
                     t = unique(panels$t), l=tail(panels$l, -1)-1,
                     name="segments")


