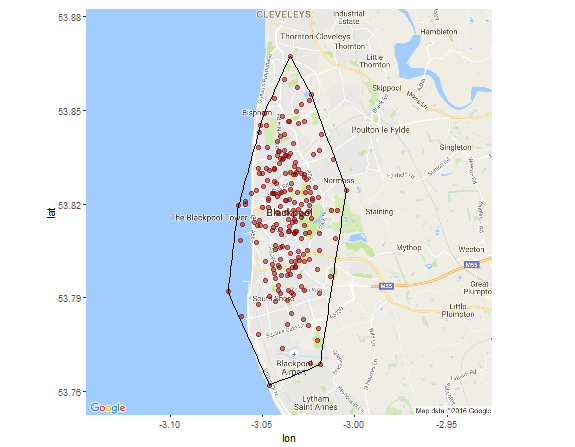
Boundary polygon of lat lon collection
Asked Answered
P

3

2

I have a table containing all the latitudes and longitudes of some locations in a city called queryResult and I do the following:

1 - Get the Raster map of the city[Blackpool for instance]

cityMapRaster = get_map(location = 'Blackpool', zoom = 12, source = 'google', maptype = 'roadmap')

dataToShow <- ggmap(cityMapRaster) + geom_point(aes(x = Longitude, y = Latitude), data = queryResult, alpha = .5, color = "darkred", size = 1)

print(dataToShow)

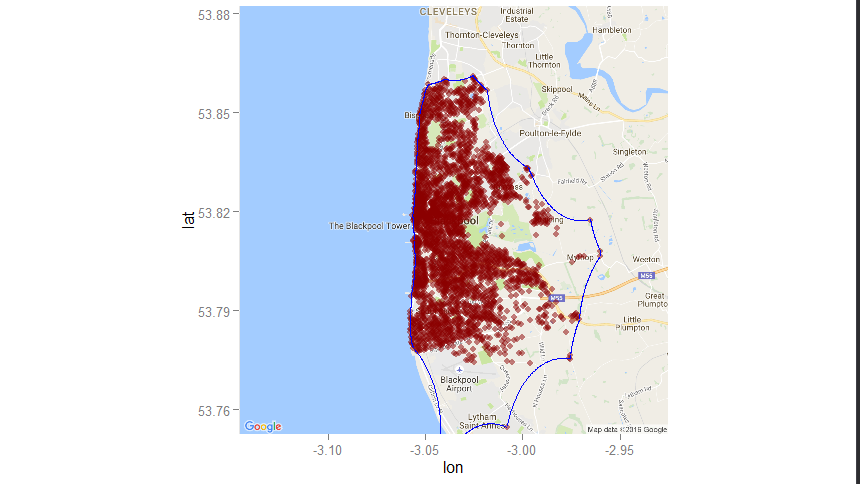
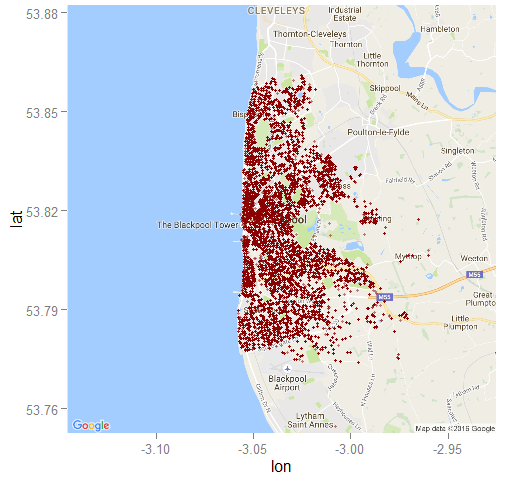
and this will return the following points on the map

enter image description here

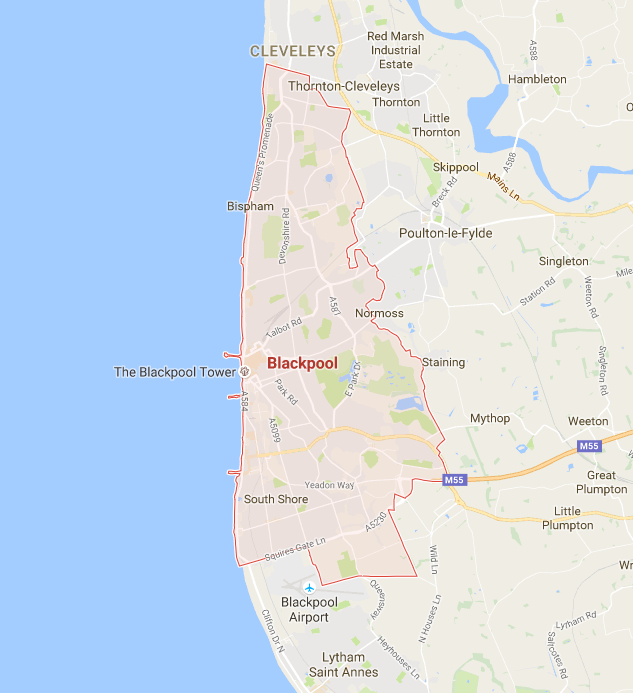
Now I want to draw the outer boundary [city border line] of all these latitude and longitudes similar to the following expected result

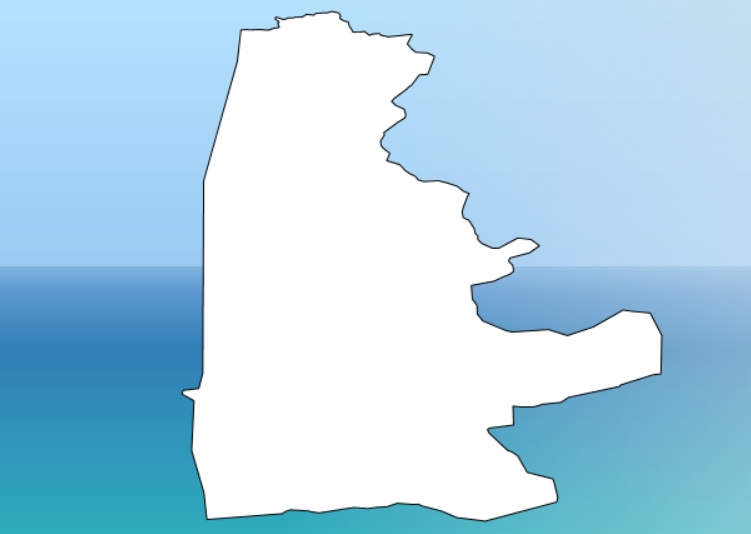
Blackpool city polygon

Update 1 : Providing input data and applying suggested ahull solution:

ggmap(cityMapRaster) + geom_point(aes(x = Longitude, y = Latitude), data = queryResult, alpha = .5, color = "darkred") + ahull.gg

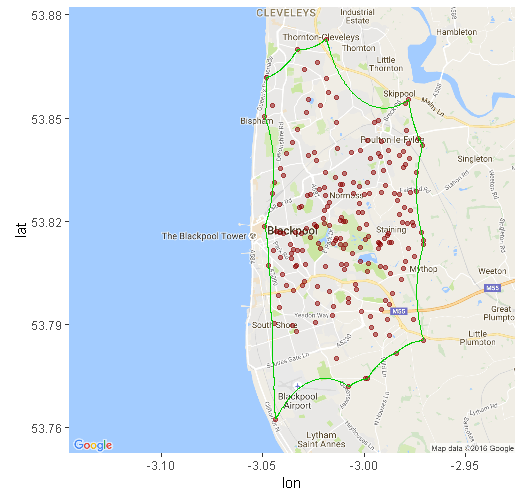
I applied the ahull solution suggested by @spacedman and @cuttlefish44 and got the following result which is far different than the expected polygon:

Applying ahull to data

You can download the .csv file containing all latitudes and longitudes from the following link : Blackpool Lat,Lon

Googles suggested area boundary looks like the following :

enter image description here

Prepossessing answered 21/10, 2016 at 15:3 Comment(7)
That boundary doesn't look much like a convex hull to me.Invoice
good point @Invoice you are correct. The sketch is more like a concave hull. I'll leave my answer up in any case. It could still be useful to someone who does want a convex hull.Crystallization
Your "expected polygon" looks like it excludes a bunch of outliers south of Blackpool, in which case how did you expect a concave hull (which by definition includes all points) to look anything like it? Why not make a kernel density estimate and cut that at some contour value?Invoice
@Spacedman, I just added the google boundary polygon for this location. In your view what sets of information is required to come up with polygons such as the one in the second picture or the ones in google? What category of polygons are these and how are they generated?Prepossessing
What's your acceptable level of accuracy? Do you think any algorithm can reproduce that exact boundary given the noisy data? Do you have any more examples of points/boundaries for replication and statistical analysis of such a question? Are you even trying to do exactly that - ie infer a formal political boundary from a set of points? What are you trying to do?Invoice
@Invoice Can I email you the answer to above questions? Stackoverflow doesn't like long comments.Prepossessing
No, edit your question, and take the opportunity to get rid of the birds nest polygon which is clearly wrong!Invoice
I
1

If you don't want a simple convex hull (and the polygon you've drawn is far from convex) then look at alpha-shapes in the alphahull package.

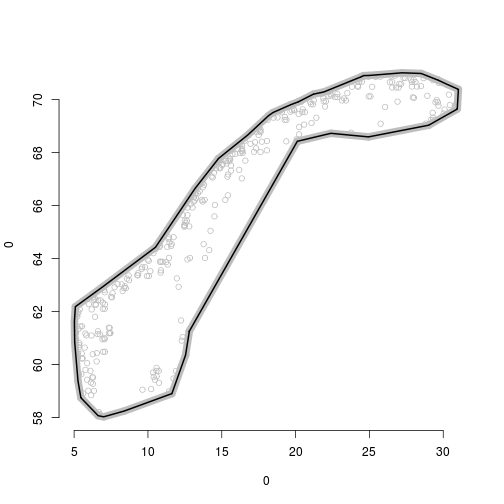
I wrote an example of how to get a polygon from an alpha-shape using that package and some points that make up a complex Norway boundary:

http://rpubs.com/geospacedman/alphasimple

enter image description here

You should be able to follow that to get a polygon for your data, and it might even be simpler now since that was a few years ago.

Invoice answered 21/10, 2016 at 18:3 Comment(1)
I applied your solution but the output doesn't resemble the polygon in the second picture. Can you tell me what kind of polygon that second boundary picture is? That is my target polygon (spatialpolygon) and I am trying to reproduce it using lat,lon data.Prepossessing
C
0

Here's a reproducible example of how to use chull to calculate a convex hull solution to this. I just generate some random points for queryResult, as you did not provide data.

If you prefer a concave hull boundary, then see the answer from @Spacedman

library(ggmap)
cityMapRaster = get_map(location = 'Blackpool', zoom = 12, source = 'google', maptype = 'roadmap')
extent = attr(cityMapRaster, "bb")
queryResult = data.frame(Longitude = rnorm(200, as.numeric(extent[2] + extent[4])/2, 0.01),
                         Latitude = rnorm(200, as.numeric(extent[1] + extent[3])/2, 0.02))

boundary = chull(as.matrix(queryResult))

ggmap(cityMapRaster) +
  geom_point(aes(x = Longitude, y = Latitude), 
             data = queryResult, alpha = .5, color = "darkred", size = 2) +
  geom_path(aes(x = Longitude, y = Latitude), data = queryResult[c(boundary, boundary[1]),])

enter image description here

Crystallization answered 21/10, 2016 at 17:56 Comment(0)
M
0

I suppose queryResult is x and y datasets. As far as I see, your boundary isn't convex hull, so I used alphahull package.

  ## example `queryResult`
set.seed(1)
df <- data.frame(Longitude = runif(200, -3.05, -2.97), Latitude = rnorm(200, 53.82, 0.02))

library(alphahull)

ahull.obj <- ahull(df, alpha = 0.03)
plot(ahull.obj)   # to check

  # ahull_track() returns the output as a list of geom_path objs
ahull.gg <- ahull_track(df, alpha=0.03, nps = 1000)
  ## change graphic param
for(i in 1:length(ahull.gg)) ahull.gg[[i]]$aes_params$colour <- "green3"

ggmap(cityMapRaster) + 
  geom_point(aes(x = Longitude, y = Latitude), data = df, alpha = .5, color = "darkred") +
  ahull.gg

enter image description here

  ## if you like not curve but linear
ashape.obj <- ashape(df, alpha = 0.015)
plot(ashape.obj)  # to check
ashape.df <- as.data.frame(ashape.obj$edge[,c("x1", "x2", "y1", "y2")])

ggmap(cityMapRaster) + 
  geom_point(aes(x = Longitude, y = Latitude), data = df, alpha = .5, color = "darkred") +
  geom_segment(aes(x = x1, y = y1, xend = x2, yend = y2), data = ashape.df, colour="green3", alpha=0.8)
Maeda answered 21/10, 2016 at 18:44 Comment(3)
How can you produce a polygon similar to the boundary polygon in the second picture? I have also provided the link to the lat lon data.Prepossessing
@MHOOS; I can't understand why "Mythop" connects with main area but doesn't with "Staining". Roughly speaking, I agree with @Spacedman's comment. it would be better to consider kernel density estimate, such as dataToShow + geom_density_2d(data = queryResult, aes(x = Longitude, y = Latitude)).Maeda
I added googles suggested boundary polygon for that area.I am not if they use kernel density estimate to come up with the area polygon but I will give it a try.Prepossessing

© 2022 - 2024 — McMap. All rights reserved.