How To Plot Multiple Histograms On Same Plot With Seaborn
Asked Answered
C

2

45

With matplotlib, I can make a histogram with two datasets on one plot (one next to the other, not overlay).

import matplotlib.pyplot as plt
import random

x = [random.randrange(100) for i in range(100)]
y = [random.randrange(100) for i in range(100)]
plt.hist([x, y])
plt.show()

This yields the following plot.

enter image description here

However, when I try to do this with seabron;

import seaborn as sns
sns.distplot([x, y])

I get the following error:

ValueError: color kwarg must have one color per dataset

So then I try to add some color values:

sns.distplot([x, y], color=['r', 'b'])

And I get the same error. I saw this post on how to overlay graphs, but I would like these histograms to be side by side, not overlay.

And looking at the docs it doesn't specify how to include a list of lists as the first argument 'a'.

How can I achieve this style of histogram using seaborn?

Cutlerr answered 1/4, 2016 at 17:43 Comment(0)
K
58

If I understand you correctly you may want to try something this:

fig, ax = plt.subplots()
for a in [x, y]:
    sns.distplot(a, bins=range(1, 110, 10), ax=ax, kde=False)
ax.set_xlim([0, 100])

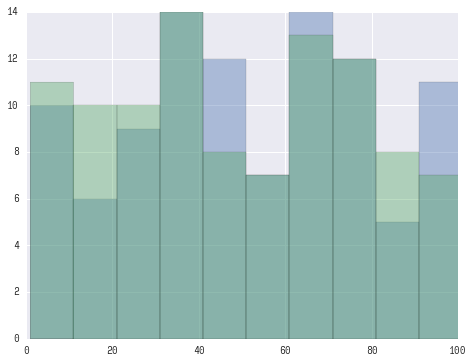
Which should yield a plot like this:

enter image description here

UPDATE:

Looks like you want 'seaborn look' rather than seaborn plotting functionality. For this you only need to:

import seaborn as sns
plt.hist([x, y], color=['r','b'], alpha=0.5)

Which will produce:

enter image description here

UPDATE for seaborn v0.12+:

After seaborn v0.12 to get seaborn-styled plots you need to:

import seaborn as sns
sns.set_theme()  # <-- This actually changes the look of plots.
plt.hist([x, y], color=['r','b'], alpha=0.5)

See seaborn docs for more information.

Kezer answered 1/4, 2016 at 20:36 Comment(6)
This looks like an overlay, but is there a way to get the bars side by side instead of superimposed?Cutlerr
How can you create a histogram in seaborn from distributions, x and y in your example, that are too large to hold in memory?Petulia
@ThomasMatthew This is a good question, but best to be addressed as a separate one (i.e. you need to ask "a new question").Kezer
module 'seaborn' has no attribute 'plot'.Bighorn
In your second chunk of code (giving the histogram a "seaborn look"), is there any particular reason you imported the seaborn package before running plt.hist()?Eleanoraeleanore
The reason for importing seaborn was to get a "seaborn look" (while it was being imported it applied its own styles to matplotlib stylesheets). Also note that recent version of seaborn (require additional command). I have updated the answer to reflect this.Kezer
S
8

Use pandas to combine x and y into a DataFrame with a name column to identify the dataset, then use sns.histplot with multiple='dodge' and hue:

import random

import matplotlib.pyplot as plt
import pandas as pd
import seaborn as sns

random.seed(2023)  # to create the same plot each time
x = [random.randrange(100) for _ in range(100)]
y = [random.randrange(100) for _ in range(100)]

df = pd.concat(axis=0, ignore_index=True, objs=[
    pd.DataFrame.from_dict({'value': x, 'name': 'x'}),
    pd.DataFrame.from_dict({'value': y, 'name': 'y'})
])

fig, ax = plt.subplots()
sns.histplot(
    data=df, x='value', hue='name', multiple='dodge',
    bins=range(1, 110, 10), ax=ax
)

sns.move_legend(ax, bbox_to_anchor=(1, 0.5), loc='center left', frameon=False)

enter image description here

df

     value name
  0     49    x
  1     89    x
  2     57    x
  3     49    x
  4     40    x
...
195     15    y
196     70    y
197     38    y
198     75    y
199     29    y
Serous answered 10/4, 2021 at 5:6 Comment(3)
Why for _ in range() instead of for i in range()? see https://mcmap.net/q/48385/-what-is-the-purpose-of-the-single-underscore-quot-_-quot-variable-in-pythonSpinneret
_ because the i isn't being used in the comprehension. We're calling the function random.randrange(100) without using the values generated by the range function, which is why the throw-away variable is more appropriate (to indicate we're not using the variable i). Packages were reordered to meet PEP8 import guidelines. "Imports should be grouped in the following order: (1) Standard library imports. (2) Related third party imports ... You should put a blank line between each group of imports." @SpinneretAlisonalissa
If your datasets are different size and you'd like to compare their individual probabilities, add stat='probability', common_norm=False.Succinate

© 2022 - 2024 — McMap. All rights reserved.