Top label for matplotlib colorbars
Asked Answered
W

2

45

By default, matplotlib would position colorbar labels alongside the vertical colorbars. What is the best way to force the label to be on top of a colorbar? Currently my solution needs adjusting labelpad and y values depending on size of the label:

import numpy as np
import matplotlib.pylab as plt 

dat = np.random.randn(10,10)
plt.imshow(dat, interpolation='none')

clb = plt.colorbar()
clb.set_label('label', labelpad=-40, y=1.05, rotation=0)

plt.show()

colorbar top label

Is there a better, more generic way to do this?

Worldly answered 16/11, 2015 at 14:11 Comment(0)
P
80

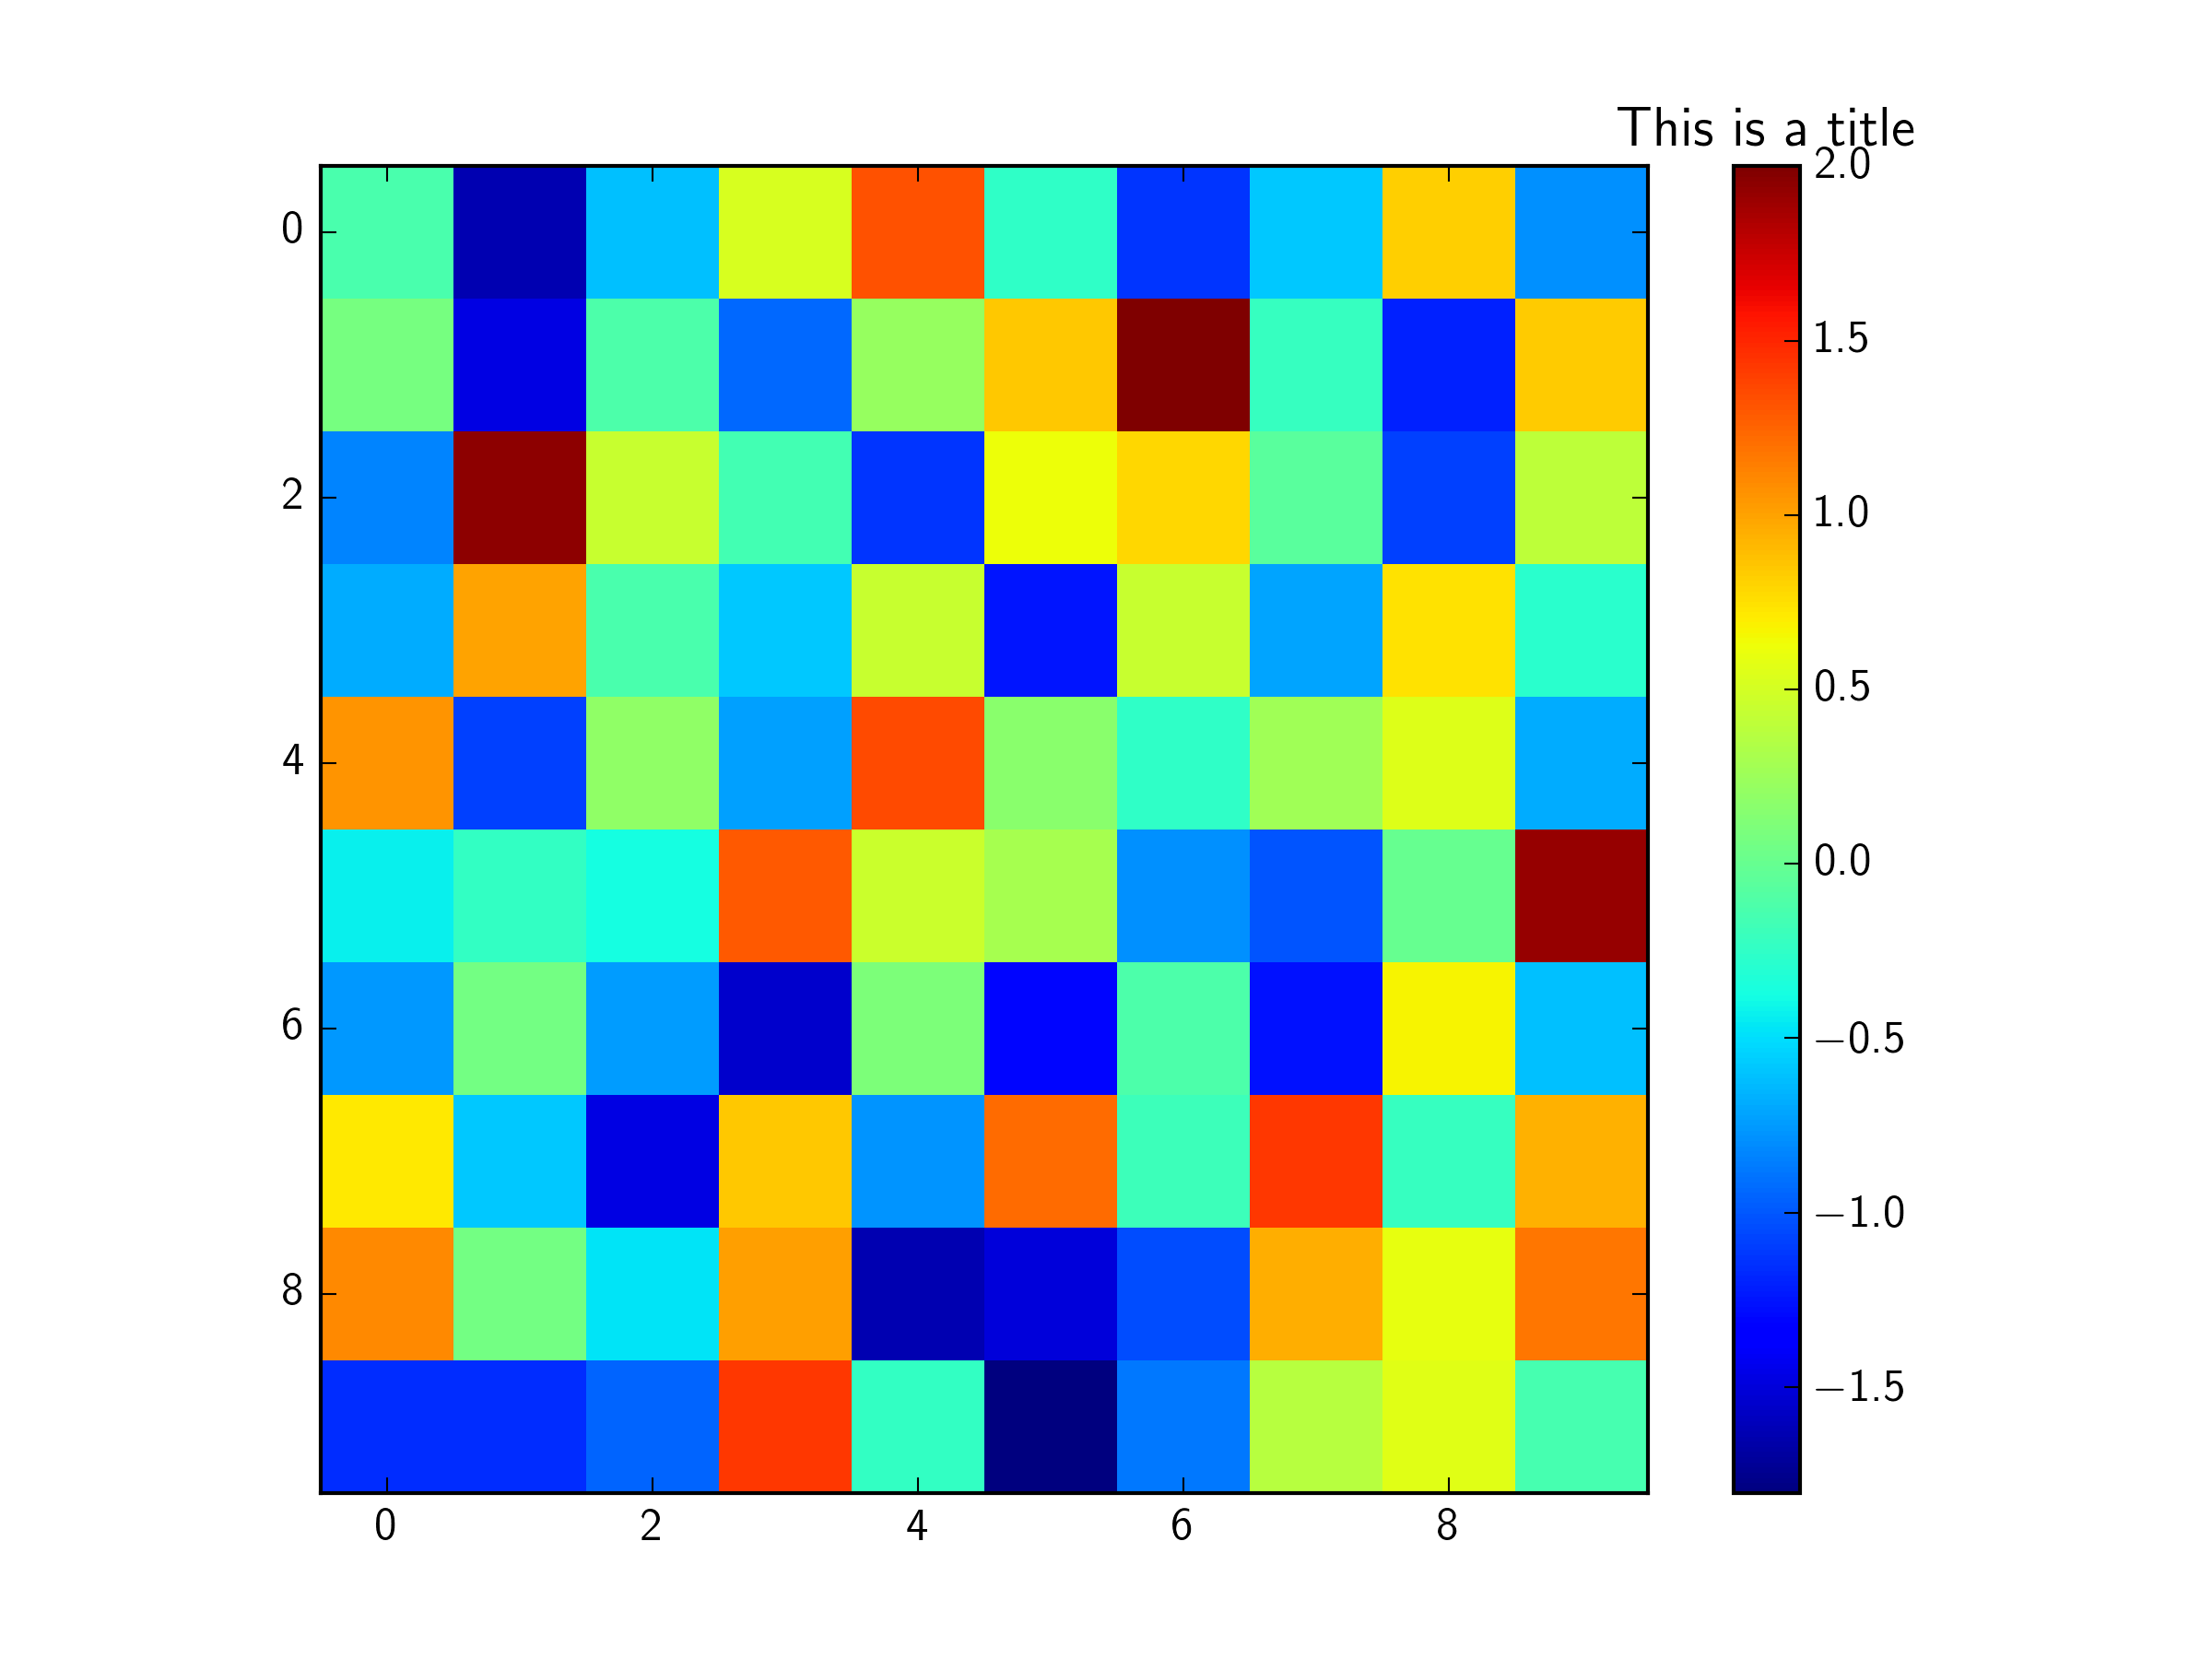
You could set the title of the colorbar axis (which appears above the axis), rather than the label (which appears along the long axis). To access the colorbar's Axes, you can use clb.ax. You can then use set_title, in the same way you can for any other Axes instance.

For example:

import numpy as np
import matplotlib.pylab as plt 

dat = np.random.randn(10,10)
plt.imshow(dat, interpolation='none')

clb = plt.colorbar()
clb.ax.set_title('This is a title')

plt.show()

enter image description here

Pound answered 16/11, 2015 at 16:54 Comment(1)
You can also clb.ax.set_xlabel('Values') to put it at bottom.Melidamelilot
E
2

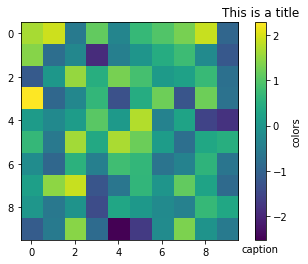
Colorbars are stored in the list of Axes in the Figure. So colorbar title/label can be set by accessing the Axes containing the colorbar as well. Since it is an Axes object, set() method is defined on it which can be used to modify numerous properties such as title, xlabel, ylabel, ticks etc.

import numpy as np
import matplotlib.pylab as plt

dat = np.random.randn(10,10)
plt.imshow(dat, interpolation='none')
plt.colorbar()
plt.gcf().axes     # [<Axes: >, <Axes: label='<colorbar>'>]
plt.gcf().axes[1].set(title='This is a title', xlabel='caption', ylabel='colors');

Using subplots, the same plot can be coded as follows.

fig, ax = plt.subplots()
ax.imshow(dat, interpolation='none')
fig.colorbar(ax.images[0], ax=ax)
fig.axes[1].set(title='This is a title', xlabel='caption', ylabel='colors');

image2

Enumerate answered 27/5, 2023 at 7:42 Comment(0)

© 2022 - 2024 — McMap. All rights reserved.