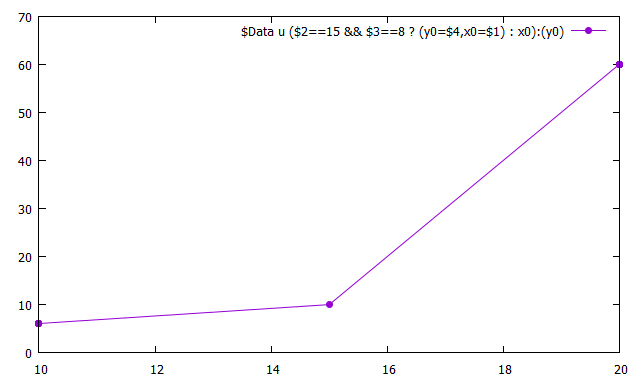
My data looks like this:
10:15:8:6.06000000:
10:15:2:19.03400000:
10:20:8:63.50600000:
10:20:2:24.71800000:
10:25:8:33.26200000:
10:30:8:508.23400000:
20:15:8:60.06300000:
20:15:2:278.63100000:
20:20:8:561.18000000:
20:20:2:215.46600000:
20:25:8:793.36000000:
20:25:2:2347.52900000:
20:30:8:5124.98700000:
20:30:2:447.41000000:
(...)
I'd like to plot a "linespoints" plot with $1 on the x-axis, and 8 different lines representing each combination of ($2,$3), e.g.: (15,8), (15,2), ...
In order to do this sort of conditional plotting, people suggest the following:
plot 'mydata.dat' using 1:($2==15 && $3==8 ? $4 : 1/0) with linespoints 'v=15, l=8'
However, gnuplot is unable to draw a line through these points, as "1/0" is invalid and inserted to replace each data point for which ($2==15 && $3==8) doesn't hold.
Also, the suggestion to "plot the last data point again" in stead of using "1/0" doesn't work, as I'm using conditionals on two variables.
Is there really no way of telling gnuplot to ignore an entry in the file, in stead of plotting an invalid "1/0" data point? Note that replacing it by "NaN" yields the same result.
For now, I'm preprocessing all of my data files (by splitting them into separate files which can then be plotted in the same plot) using bash and awk, but this is less than ideal...
Thanks!


