How to check the replication delay in PostgreSQL?
Asked Answered
I

8

47

I would like to measure time between insert data into master-table and slave-table using streaming replication in PostgreSQL 9.3. For this I create table test_time with 2 fields id(serial), t(text). After that added a trigger:

cur_time:=to_char(current_timestamp, 'HH12:MI:SS:MS:US'); update test_time set t=cur_time where id=new.id;

But the time is the same in both tables. How can I measure delay time

Indiscretion answered 4/2, 2015 at 14:4 Comment(2)
Yes of course the time is the same. The data on the slave is a 100% identical copy of the master. It wouldn't make sense if the data was changed on the way to the slave.Regan
Is there another way to measure delay time between master and slave tables?Indiscretion
D
29

You can get the delay in bytes from the master side quite easily using pg_xlog_location_diff to compare the master's pg_current_xlog_insert_location with the replay_location for that backend's pg_stat_replication entry.

This only works when run on the master. You can't do it from the replica because the replica has no idea how far ahead the master is.

Additionally this won't tell you the lag in seconds. In current (as of 9.4 at least) PostgreSQL versions there's no timestamp associated with a commit or a WAL record. So there's no way to tell how long ago a given LSN (xlog position) was.

The only way to get the replica lag in seconds on a current PostgreSQL version is to have an external process commit an update to a dedicated timestamp table periodically. So you can compare current_timestamp on the replica to the timestamp of the most recent entry in that table visible on the replica to see how far the replica is behind. This creates additional WAL traffic that will then have to be kept in your archived WAL for PITR (PgBarman or whatever), so you should balance the increased data use with the granularity of lag detection you require.

PostgreSQL 9.5 may add commit timestamps that will hopefully let you find out how long ago a given commit happened and therefore how far a replica is behind in wall-clock seconds.

Daviddavida answered 6/2, 2015 at 5:35 Comment(4)
Thanks. I solved problem, using pg_last_xact_replay_timestamp();Indiscretion
@Indiscretion I should've known about that. Please post that as your own answer and I'll upvote if you leave me a comment.Daviddavida
Even if you updated a record every 100ms, that's still not a lot of traffic, in the grand scheme of things...Egyptology
The pg_stat_replication view now contains replica lag as a time (write_lag, flush_lag, replay_lag): see Vao's answer below: https://mcmap.net/q/357066/-how-to-check-the-replication-delay-in-postgresqlDvorak
S
43

Alf162 mentioned a good solution in the comments to Craig Ringer's answer; so I'm adding this to clarify.

PostgreSQL has an administrative function pg_last_xact_replay_timestamp() which returns time stamp of the last transaction replayed during recovery. This is the time at which the commit or abort WAL record for that transaction was generated on the primary.

So this query select now()-pg_last_xact_replay_timestamp() as replication_lag on a replica will return a duration representing the difference in time between the current clock and the timestamp of the last WAL record applied from the replication stream.

Note that if the master is not receiving new mutations, there will be no WAL records to stream and the lag calculated this way will grow without actually being a signal of delays in replication. If the master is under more or less continuous mutation, it will be continuously streaming WALs and the above query is a fine approximation of the time delay for changes on the master to materialize on the slave. Accuracy will obviously be affected by how rigorously synchronized the system clocks on the two hosts are.

Sanguinaria answered 18/3, 2015 at 18:18 Comment(4)
The note about the clock sync is critically important. No NTP daemon running means you probably don't have the same clock. This just helped me solve a steadily-falling-behind-slave issue that was, in fact, just clock drift. It's useful to see how many bytes behind you are in addition to time as a sanity check.Windjammer
This solution is only viable on highly active instances. If you have periods of inativity in your database you will face false negatives. IMO relying on sent_lsn, replay_lsn and write_lsn is a better option. The concept of time is not a thing in the contet of PG.Niven
@Niven I think I commented on the need for activity to make this work in the original answer. The metrics you mention were introduced in v10, not available at the time this answer was originally written. I suggest you submit an independent answer describing your advised approach using them.Sanguinaria
Also, if we're updating for v10, please see this answer below describing synchronous replication lag metrics now available.Sanguinaria
D
29

You can get the delay in bytes from the master side quite easily using pg_xlog_location_diff to compare the master's pg_current_xlog_insert_location with the replay_location for that backend's pg_stat_replication entry.

This only works when run on the master. You can't do it from the replica because the replica has no idea how far ahead the master is.

Additionally this won't tell you the lag in seconds. In current (as of 9.4 at least) PostgreSQL versions there's no timestamp associated with a commit or a WAL record. So there's no way to tell how long ago a given LSN (xlog position) was.

The only way to get the replica lag in seconds on a current PostgreSQL version is to have an external process commit an update to a dedicated timestamp table periodically. So you can compare current_timestamp on the replica to the timestamp of the most recent entry in that table visible on the replica to see how far the replica is behind. This creates additional WAL traffic that will then have to be kept in your archived WAL for PITR (PgBarman or whatever), so you should balance the increased data use with the granularity of lag detection you require.

PostgreSQL 9.5 may add commit timestamps that will hopefully let you find out how long ago a given commit happened and therefore how far a replica is behind in wall-clock seconds.

Daviddavida answered 6/2, 2015 at 5:35 Comment(4)
Thanks. I solved problem, using pg_last_xact_replay_timestamp();Indiscretion
@Indiscretion I should've known about that. Please post that as your own answer and I'll upvote if you leave me a comment.Daviddavida
Even if you updated a record every 100ms, that's still not a lot of traffic, in the grand scheme of things...Egyptology
The pg_stat_replication view now contains replica lag as a time (write_lag, flush_lag, replay_lag): see Vao's answer below: https://mcmap.net/q/357066/-how-to-check-the-replication-delay-in-postgresqlDvorak
L
16

If your database has frequent writes, then the below query is a close approximation to get the slave lag

select now() - pg_last_xact_replay_timestamp() AS replication_delay;

Below is a more accurate query for calculating replication lag for databases with very few writes. If the master doesnt sent down any write to the slave, then pg_last_xact_replay_timestamp() can be constant and hence may not accurately determine the slave lag using the above query.

SELECT CASE WHEN pg_last_xlog_receive_location() =
pg_last_xlog_replay_location() THEN 0 ELSE EXTRACT (EPOCH FROM now() -
pg_last_xact_replay_timestamp()) END AS log_delay;
Lockwood answered 6/5, 2016 at 18:53 Comment(1)
This functions have been renamed to pg_last_wal_receive_lsn() and pg_last_wal_replay_lsn() a while ago.Piscatory
T
15

PostgreSQL 10 or later (answer)

For postgresql 10 or later (function pg_last_xlog_receive_location() and others does not exist in this version), I use this:

SELECT
  pg_is_in_recovery() AS is_slave,
  pg_last_wal_receive_lsn() AS receive,
  pg_last_wal_replay_lsn() AS replay,
  pg_last_wal_receive_lsn() = pg_last_wal_replay_lsn() AS synced,
  (
   EXTRACT(EPOCH FROM now()) -
   EXTRACT(EPOCH FROM pg_last_xact_replay_timestamp())
  )::int AS lag;

if you run this query on master, the results will be:

 is_slave | receive | replay | synced | lag 
----------+---------+--------+--------+-----
 f        |         |        |        |    
(1 row)

if you run this query on synced slave, the results will be like:

 is_slave |  receive  |  replay   | synced | lag 
----------+-----------+-----------+--------+-----
 t        | 0/3003128 | 0/3003128 | t      | 214
(1 row)

if you run this query on NOT synced slave, the results will be like:

 is_slave |  receive  |  replay   | synced | lag 
----------+-----------+-----------+--------+-----
 t        | 0/30030F0 | 0/30023B0 | f      | 129
(1 row)

NOTE: lag (seconds) has a special meaning here (it is not the same that replay_lag/write_lag/flush_lag from pg_stat_replication view) and it is only useful when synced column is false, because lag means how many seconds elapsed since the last action was commited. In a low traffic site, this value is useless. But in an high traffic site, synced could (and will) be almost of time false, however if it has lag value small enough that server could be considered synced.

So, in order to discovery if that server is synced, I check (in this order):

  • IF is_slave is f (meaning that is a not a slave, maybe a master, so it is synced);
  • IF synced is t (meaning that is a synced slave, so it is synced);
  • IF (supposing applicable) lag <= :threshold: (meaning that is not a synced slave, but it is not too far from master, so it's synced enough for me).

If you want lag in seconds including decimals, do:

SELECT
  pg_is_in_recovery() AS is_slave,
  pg_last_wal_receive_lsn() AS receive,
  pg_last_wal_replay_lsn() AS replay,
  pg_last_wal_receive_lsn() = pg_last_wal_replay_lsn() AS synced,
  EXTRACT(SECONDS FROM now() - pg_last_xact_replay_timestamp())::float AS lag;
Timon answered 5/8, 2021 at 13:59 Comment(0)
D
8

slightly different version of the correct answer:

postgres=# SELECT
  pg_last_xlog_receive_location() receive,
  pg_last_xlog_replay_location() replay,
  (
   extract(epoch FROM now()) -
   extract(epoch FROM pg_last_xact_replay_timestamp())
  )::int lag;

  receive   |   replay   |  lag  
------------+------------+-------
 1/AB861728 | 1/AB861728 | 2027

the lag is only important when "receive" not equal "replay". execute the query on the replica

Doughy answered 24/10, 2015 at 20:48 Comment(2)
Should this be run in the master or the slave? (I guess the slave but please add it in the answer).Vacillation
On slave since you are asking the received log.Unconsidered
C
8

as of 10 release:

https://www.postgresql.org/docs/10/static/monitoring-stats.html#pg-stat-replication-view

write_lag interval Time elapsed between flushing recent WAL locally and receiving notification that this standby server has written it (but not yet flushed it or applied it). This can be used to gauge the delay that synchronous_commit level remote_write incurred while committing if this server was configured as a synchronous standby.

flush_lag interval Time elapsed between flushing recent WAL locally and receiving notification that this standby server has written and flushed it (but not yet applied it). This can be used to gauge the delay that synchronous_commit level remote_flush incurred while committing if this server was configured as a synchronous standby.

replay_lag interval Time elapsed between flushing recent WAL locally and receiving notification that this standby server has written, flushed and applied it. This can be used to gauge the delay that synchronous_commit level remote_apply incurred while committing if this server was configured as a synchronous standby.

(formatting mine)

Alas new columns seem to suit only synchronous replication (otherwise master would not know exact lag) thus async replication delay chack seem to remain now()-pg_last_xact_replay_timestamp()...

Continuity answered 10/10, 2017 at 9:0 Comment(1)
the post topic does not specify sync type thus I suppose above info may help smbd to find it hereContinuity
R
1

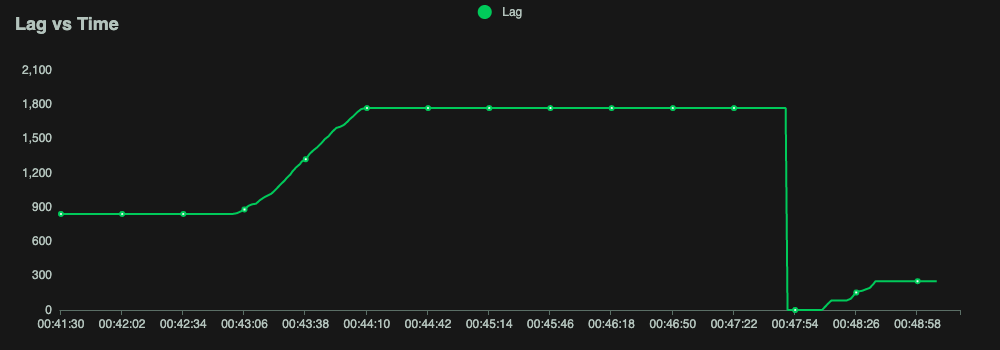
You can use this simple CLI based opensource tool that can provide realtime visualisation about replication lag using various modes e.g. CLI, web mode as well as matplotlib based charts for easy tracking.

Replication-Lag-Visualizer

Feel free to raise any issues or contribute to it.

Web Mode

Rend answered 2/10, 2021 at 12:32 Comment(0)
C
0

on master, you can do select * from pg_stat_replication;
this will give you:

|  sent_lsn   |  write_lsn  |  flush_lsn  | replay_lsn  

-+-------------+-------------+-------------+-------------

 | 8D/2DA48000 | 8D/2DA48000 | 8D/2DA48000 | 89/56A0D500 

those can tell you where your offsets are. as you can see from this example, replay on the replica is behind.

Cardiff answered 21/9, 2018 at 18:26 Comment(1)
No such columns in pg_stat_replication in PostgreSQL 9.3, which is what this question explicitly asked about.Obtect

© 2022 - 2024 — McMap. All rights reserved.