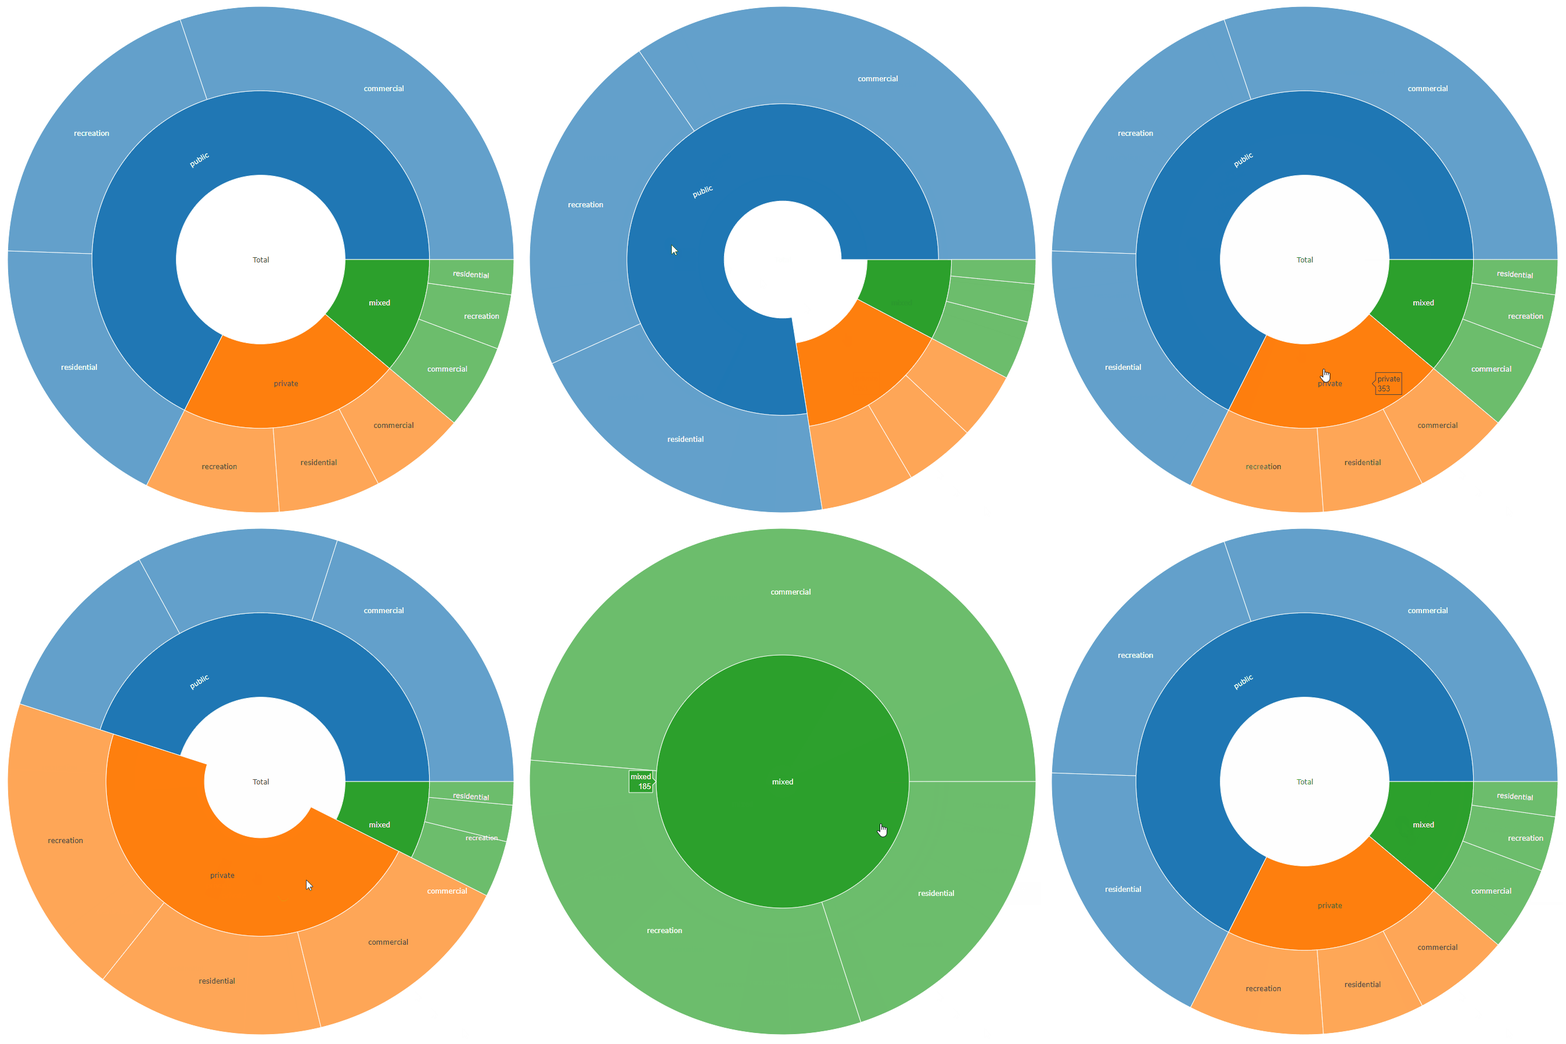
You are absolutely right, compared to the rest of the intuitiv usage of plotly's R API preparing data for a sunburst (or treemap) chart is rather annoying.
I had the same problem and wrote a function based on library(data.table) to prepare the data, accepting two different data.frame input formats.
The format required to generate a sunburst plot using data similarly structured as yours can be seen here under the section Sunburst with Repeated Labels.
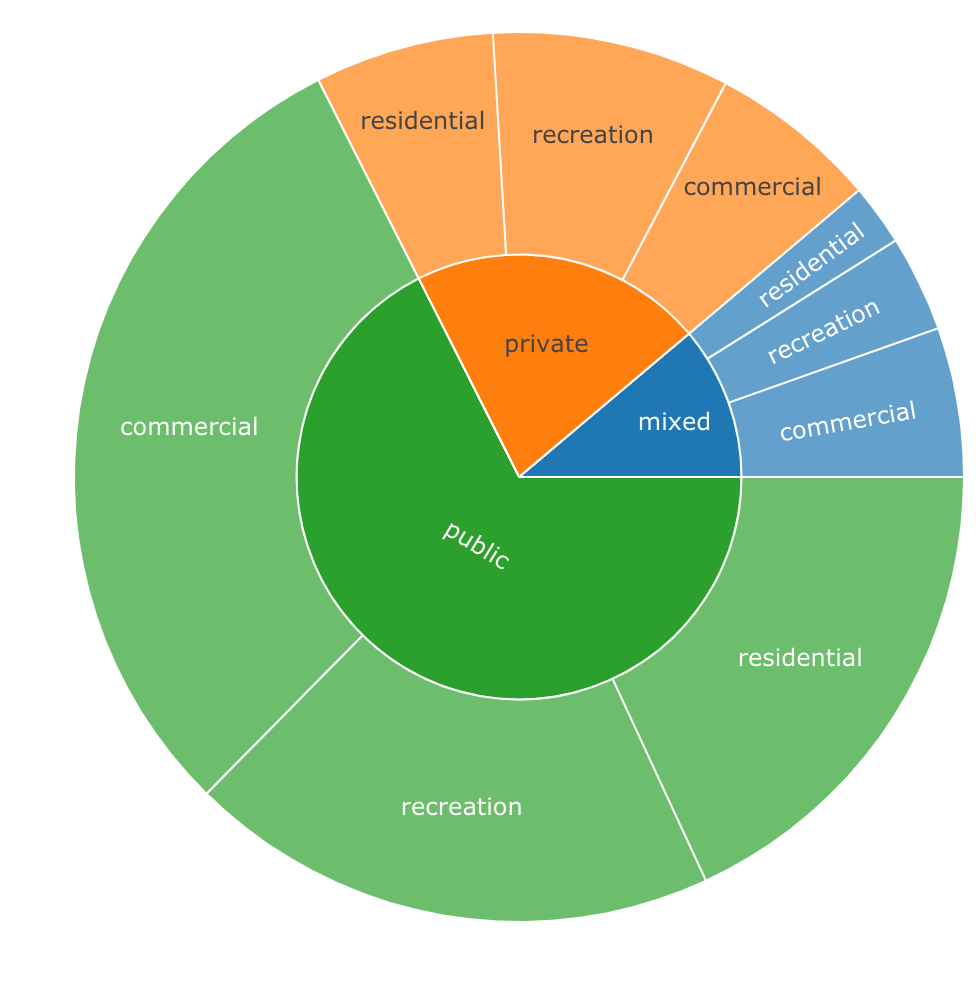
For your example it should look like this:
         labels values         parents                           ids
 1:       total   1658            <NA>                         total
 2:     private    353           total               total - private
 3:      public   1120           total                total - public
 4:       mixed    185           total                 total - mixed
 5: residential    108 total - private total - private - residential
 6:  recreation    143 total - private  total - private - recreation
 7:  commercial    102 total - private  total - private - commercial
 8: residential    300  total - public  total - public - residential
 9:  recreation    320  total - public   total - public - recreation
10:  commercial    500  total - public   total - public - commercial
11: residential     37   total - mixed   total - mixed - residential
12:  recreation     58   total - mixed    total - mixed - recreation
13:  commercial     90   total - mixed    total - mixed - commercial
Here is the code to get there (Edit: added a parameter to drop NA nodes):
library(data.table)
library(plotly)

DF <- data.table(ownership=c(rep("private", 3), rep("public",3),rep("mixed", 3)),
                 landuse=c(rep(c("residential", "recreation", "commercial"),3)),
                 acres=c(108, 143, 102, 300, 320, 500, 37, 58, 90))

as.sunburstDF <- function(DF, value_column = NULL, add_root = FALSE, drop_na_nodes = TRUE){
  colNamesDF <- names(DF)

  if(is.data.table(DF)){
    DT <- copy(DF)
  } else {
    DT <- data.table(DF, stringsAsFactors = FALSE)
  }

  if(add_root){
    DT[, root := "Total"]
  }

  colNamesDT <- names(DT)
  hierarchy_columns <- setdiff(colNamesDT, value_column)
  numeric_hierarchy_columns <- names(which(unlist(lapply(DT, is.numeric))))

  if(is.null(value_column) && add_root){
    setcolorder(DT, c("root", colNamesDF))
  } else if(!is.null(value_column) && !add_root) {
    setnames(DT, value_column, "values", skip_absent=TRUE)
    setcolorder(DT, c(setdiff(colNamesDF, value_column), "values"))
  } else if(!is.null(value_column) && add_root) {
    setnames(DT, value_column, "values", skip_absent=TRUE)
    setcolorder(DT, c("root", setdiff(colNamesDF, value_column), "values"))
  }

  for(current_column in setdiff(numeric_hierarchy_columns, c("root", value_column))){
    DT[, (current_column) := apply(.SD, 1, function(x){fifelse(is.na(x), yes = NA_character_, no = toTitleCase(gsub("_"," ", paste(names(x), x, sep = ": ", collapse = " | "))))}), .SDcols = current_column]
  }

  hierarchyList <- list()
  for(i in seq_along(hierarchy_columns)){
    current_columns <- colNamesDT[1:i]

    if(is.null(value_column)){
      currentDT <- unique(DT[, ..current_columns][, values := .N, by = current_columns], by = current_columns)
    } else {
      currentDT <- DT[, lapply(.SD, sum, na.rm = TRUE), by=current_columns, .SDcols = "values"]
    }

    setnames(currentDT, length(current_columns), "labels")
    currentDT[, depth := length(current_columns)-1]
    hierarchyList[[i]] <- currentDT
  }

  hierarchyDT <- rbindlist(hierarchyList, use.names = TRUE, fill = TRUE)

  if(drop_na_nodes){
    hierarchyDT <- na.omit(hierarchyDT, cols = "labels")
    parent_columns <- setdiff(names(hierarchyDT), c("labels", "values", "depth", value_column))
    hierarchyDT[, parents := apply(.SD, 1, function(x){fifelse(all(is.na(x)), yes = NA_character_, no = paste(x[!is.na(x)], sep = ":", collapse = " - "))}), .SDcols = parent_columns]
  } else {
    parent_columns <- setdiff(names(hierarchyDT), c("labels", "values", value_column))
    hierarchyDT[, parents := apply(.SD, 1, function(x){fifelse(x["depth"] == "0", yes = NA_character_, no = paste(x[seq(2, as.integer(x["depth"])+1)], sep = ":", collapse = " - "))}), .SDcols = parent_columns]
  }

  hierarchyDT[, ids := apply(.SD, 1, function(x){paste(c(if(is.na(x["parents"])){NULL}else{x["parents"]}, x["labels"]), collapse = " - ")}), .SDcols = c("parents", "labels")]
  hierarchyDT[, union(parent_columns, "depth") := NULL]

  return(hierarchyDT)
}

sunburstDF <- as.sunburstDF(DF, value_column = "acres", add_root = TRUE)

plot_ly(data = sunburstDF, ids = ~ids, labels= ~labels, parents = ~parents, values= ~values, type='sunburst', branchvalues = 'total')
![result]()
Here is an example for the second data.frame format accepted by the function (value_column = NULL, because it is calculated from the data):
DF2 <- data.frame(sample(LETTERS[1:3], 100, replace = TRUE),
                  sample(LETTERS[4:6], 100, replace = TRUE),
                  sample(LETTERS[7:9], 100, replace = TRUE),
                  sample(LETTERS[10:12], 100, replace = TRUE),
                  sample(LETTERS[13:15], 100, replace = TRUE),
                  stringsAsFactors = FALSE)

plot_ly(data = as.sunburstDF(DF2, add_root = TRUE), ids = ~ids, labels= ~labels, parents = ~parents, values= ~values, type='sunburst', branchvalues = 'total')
Please also see library(sunburstR) as an alternative.
Edit: Added a benchmark regarding the dplyr based count_to_sunburst() function from library(plotme) (see below), which on my system is around 5 times slower than the data.table version.
Unit: milliseconds
          expr     min       lq     mean   median       uq      max neval
        plotme 50.4618 53.09425 60.92404 55.37815 63.62315 122.3842   100
 ismirsehregal  8.6553 10.28870 12.63881 11.53760 12.26620 108.2025   100
Code to reproduce the benchmark:
# devtools::install_github("yogevherz/plotme")

library(microbenchmark)
library(plotme)
library(dplyr)
library(data.table)
library(plotly)

DF <- data.frame(ownership=c(rep("private", 3), rep("public",3),rep("mixed", 3)),
                 landuse=c(rep(c("residential", "recreation", "commercial"),3)),
                 acres=c(108, 143, 102, 300, 320, 500, 37, 58, 90))

as.sunburstDF <- function(DF, value_column = NULL, add_root = FALSE){
  require(data.table)

  colNamesDF <- names(DF)

  if(is.data.table(DF)){
    DT <- copy(DF)
  } else {
    DT <- data.table(DF, stringsAsFactors = FALSE)
  }

  if(add_root){
    DT[, root := "Total"]
  }

  colNamesDT <- names(DT)
  hierarchy_columns <- setdiff(colNamesDT, value_column)
  DT[, (hierarchy_columns) := lapply(.SD, as.factor), .SDcols = hierarchy_columns]

  if(is.null(value_column) && add_root){
    setcolorder(DT, c("root", colNamesDF))
  } else if(!is.null(value_column) && !add_root) {
    setnames(DT, value_column, "values", skip_absent=TRUE)
    setcolorder(DT, c(setdiff(colNamesDF, value_column), "values"))
  } else if(!is.null(value_column) && add_root) {
    setnames(DT, value_column, "values", skip_absent=TRUE)
    setcolorder(DT, c("root", setdiff(colNamesDF, value_column), "values"))
  }

  hierarchyList <- list()

  for(i in seq_along(hierarchy_columns)){
    current_columns <- colNamesDT[1:i]
    if(is.null(value_column)){
      currentDT <- unique(DT[, ..current_columns][, values := .N, by = current_columns], by = current_columns)
    } else {
      currentDT <- DT[, lapply(.SD, sum, na.rm = TRUE), by=current_columns, .SDcols = "values"]
    }
    setnames(currentDT, length(current_columns), "labels")
    hierarchyList[[i]] <- currentDT
  }

  hierarchyDT <- rbindlist(hierarchyList, use.names = TRUE, fill = TRUE)

  parent_columns <- setdiff(names(hierarchyDT), c("labels", "values", value_column))
  hierarchyDT[, parents := apply(.SD, 1, function(x){fifelse(all(is.na(x)), yes = NA_character_, no = paste(x[!is.na(x)], sep = ":", collapse = " - "))}), .SDcols = parent_columns]
  hierarchyDT[, ids := apply(.SD, 1, function(x){paste(x[!is.na(x)], collapse = " - ")}), .SDcols = c("parents", "labels")]
  hierarchyDT[, c(parent_columns) := NULL]
  return(hierarchyDT)
}

microbenchmark(plotme = {
  DF %>%
    rename(n = acres) %>%
    count_to_sunburst()
}, ismirsehregal = {
  plot_ly(data = as.sunburstDF(DF, value_column = "acres", add_root = TRUE), ids = ~ids, labels= ~labels, parents = ~parents, values= ~values, type='sunburst', branchvalues = 'total')
})


fin theifelsestatement -function(x){fifelse(all(is.na(x)). – Catachresis