Graphviz, dot, ortho plots do not respect ports
Asked Answered
O

1

49

I am using graphviz and would like to render my graphs with splines = ortho. The problem is that the edges don't respect ports, so it is not possible to analyse the graph.

digraph G{
splines= ortho;

A [shape = box, label =<
                <TABLE BORDER="0" CELLBORDER="0" CELLSPACING="1"
CELLPADDING="2">
                <TR> <TD COLSPAN = "3"> A </TD></TR>

                <TR><TD PORT="1" BORDER = "1"> 1 </TD>
                        <TD ></TD>
                        <TD PORT="2" BORDER = "1"> 2 </TD>
                    </TR>
                </TABLE>>];

B [shape = box, label =<
                <TABLE BORDER="0" CELLBORDER="0" CELLSPACING="1"
CELLPADDING="2">
                <TR> <TD COLSPAN = "3"> B </TD></TR>

                <TR><TD PORT="1" BORDER = "1"> 1 </TD>
                        <TD ></TD>
                        <TD PORT="2" BORDER = "1"> 2 </TD>
                    </TR>
                </TABLE>>];

C [shape = box, style = filled, label =<
                <TABLE BORDER="0" CELLBORDER="0" CELLSPACING="1"
CELLPADDING="2">
                <TR> <TD COLSPAN = "3"> C </TD></TR>

                <TR><TD PORT="1" BORDER = "1"> 1 </TD>
                        <TD ></TD>
                        <TD PORT="2" BORDER = "1"> 2 </TD>
                    </TR>
                <TR> <TD PORT = "3" BORDER = "1"> 3 </TD></TR>
                </TABLE>>];

K [shape = box, label =<
                <TABLE BORDER="0" CELLBORDER="0" CELLSPACING="1"
CELLPADDING="2">
                <TR> <TD COLSPAN = "3"> K </TD></TR>

                <TR><TD PORT="1" BORDER = "1"> 1 </TD>
                        <TD ></TD>
                        <TD PORT="2" BORDER = "1"> 2 </TD>
                    </TR>
                </TABLE>>];

A:1 -> B:2;
A:2 -> B:2;
A:2 -> C:1;
B:1 -> C:1;
K:2 -> C:1;
B:2 -> K:1;
K:2 -> A:1;
B:1 -> C:3;
K:2 -> D;
K:2 -> E;
}

result:

splines = ortho result

I found the issue on the official graphviz site but there seems to be no improvement since 2011. Does anyone know a way to circumvent the problem? Or is there a chance that I can fix it myself?

Orchestrion answered 10/5, 2016 at 10:43 Comment(7)
I think this is still true now with graphviz 2.38.0-12ubuntu2.1.Emigrant
For the record, here are a couple of related issues: [Dot] ortho plots do not respect ports. also arrowheads seem to go the wrong way. spline = ortho produces unexpected output with portsToluene
Still haven't a solution in 2019 :(Erda
Many things happened in 2020 (so far), but fixing this behaviour was not one of them. v2.45.225 still has itSwanner
Interested by having this bug fixed as well (July '20)Thetisa
Still not working for v 2.46Thetisa
Still not working in 2022. :-(Adapt
L
1

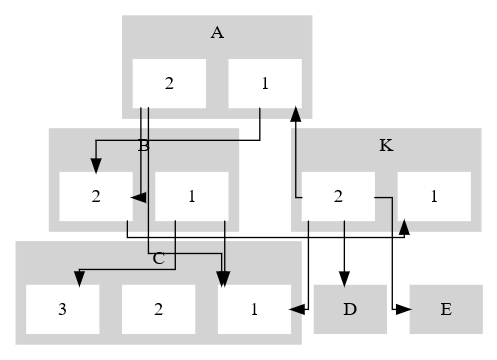
I think you can achieve what you are trying to do using subgraphs:

digraph G{
splines= ortho;

subgraph cluster_0 {
        style=filled;
        color=lightgrey;
        node [style=filled,color=white,shape=box,label="1"];
        a1;
        node [style=filled,color=white,shape=box,label="2"];
        a2;
        label = "A";
    }

subgraph cluster_1 {
        style=filled;
        color=lightgrey;
        node [style=filled,color=white,shape=box,label="1"];
        b1;
        node [style=filled,color=white,shape=box,label="2"];
        b2;
        label = "B";
    }

subgraph cluster_2 {
        style=filled;
        color=lightgrey;
        node [style=filled,color=white,shape=box,label="1"];
        c1;
        node [style=filled,color=white,shape=box,label="2"];
        c2;
        node [style=filled,color=white,shape=box,label="3"];
        c3;
        label = "C";
    }

subgraph cluster_3 {
        style=filled;
        color=lightgrey;
        node [style=filled,color=white,shape=box,label="1"];
        k1;
        node [style=filled,color=white,shape=box,label="2"];
        k2;
        label = "K";
    }

D [style=filled,color=white,shape=box,color=lightgrey;]
E [style=filled,color=white,shape=box,color=lightgrey;]

a1 -> b2;
a2 -> b2;
a2 -> c1;
b1 -> c1;
k2 -> c1;
b2 -> k1;
k2 -> a1;
b1 -> c3;
k2 -> D;
k2 -> E;
}

Result:

Graphviz Output

Lunge answered 9/6, 2023 at 10:46 Comment(0)

© 2022 - 2024 — McMap. All rights reserved.