I know that principal component analysis does a SVD on a matrix and then generates an eigen value matrix. To select the principal components we have to take only the first few eigen values. Now, how do we decide on the number of eigen values that we should take from the eigen value matrix?
To decide how many eigenvalues/eigenvectors to keep, you should consider your reason for doing PCA in the first place. Are you doing it for reducing storage requirements, to reduce dimensionality for a classification algorithm, or for some other reason? If you don't have any strict constraints, I recommend plotting the cumulative sum of eigenvalues (assuming they are in descending order). If you divide each value by the total sum of eigenvalues prior to plotting, then your plot will show the fraction of total variance retained vs. number of eigenvalues. The plot will then provide a good indication of when you hit the point of diminishing returns (i.e., little variance is gained by retaining additional eigenvalues).
There is no correct answer, it is somewhere between 1 and n.
Think of a principal component as a street in a town you have never visited before. How many streets should you take to get to know the town?
Well, you should obviously visit the main street (the first component), and maybe some of the other big streets too. Do you need to visit every street to know the town well enough? Probably not.
To know the town perfectly, you should visit all of the streets. But what if you could visit, say 10 out of the 50 streets, and have a 95% understanding of the town? Is that good enough?
Basically, you should select enough components to explain enough of the variance that you are comfortable with.
As others said, it doesn't hurt to plot the explained variance.
If you use PCA as a preprocessing step for a supervised learning task, you should cross validate the whole data processing pipeline and treat the number of PCA dimension as an hyperparameter to select using a grid search on the final supervised score (e.g. F1 score for classification or RMSE for regression).
If cross-validated grid search on the whole dataset is too costly try on a 2 sub samples, e.g. one with 1% of the data and the second with 10% and see if you come up with the same optimal value for the PCA dimensions.
There are a number of heuristics use for that.
E.g. taking the first k eigenvectors that capture at least 85% of the total variance.
However, for high dimensionality, these heuristics usually are not very good.
Depending on your situation, it may be interesting to define the maximal allowed relative error by projecting your data on ndim dimensions.
Matlab example
I will illustrate this with a small matlab example. Just skip the code if you are not interested in it.
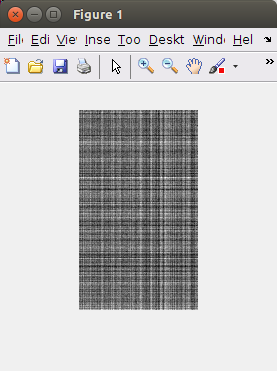
I will first generate a random matrix of n samples (rows) and p features containing exactly 100 non zero principal components.
n = 200;
p = 119;
data = zeros(n, p);
for i = 1:100
  data = data + rand(n, 1)*rand(1, p);
end
The image will look similar to:
For this sample image, one can calculate the relative error made by projecting your input data to ndim dimensions as follows:
[coeff,score] = pca(data,'Economy',true);

relativeError = zeros(p, 1);
for ndim=1:p
    reconstructed = repmat(mean(data,1),n,1) + score(:,1:ndim)*coeff(:,1:ndim)';
    residuals = data - reconstructed;
    relativeError(ndim) = max(max(residuals./data));
end
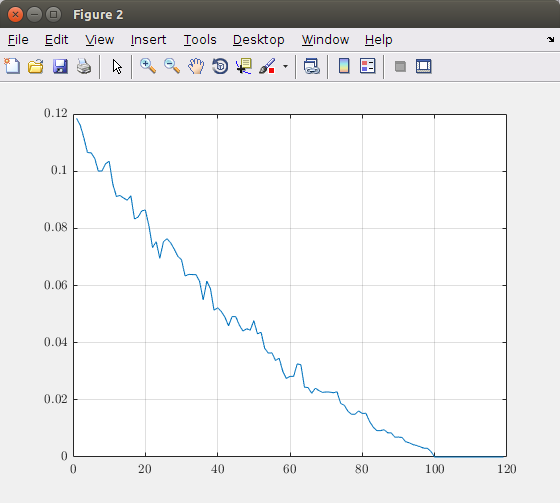
Plotting the relative error in function of the number of dimensions (principal components) results in the following graph:
Based on this graph, you can decide how many principal components you need to take into account. In this theoretical image taking 100 components result in an exact image representation. So, taking more than 100 elements is useless. If you want for example maximum 5% error, you should take about 40 principal components.
Disclaimer: The obtained values are only valid for my artificial data. So, do not use the proposed values blindly in your situation, but perform the same analysis and make a trade off between the error you make and the number of components you need.
Code reference
- Iterative algorithm is based on the source code of
pcares - A StackOverflow post about
pcares
I highly recommend the following paper by Gavish and Donoho: The Optimal Hard Threshold for Singular Values is 4/sqrt(3).
I posted a longer summary of this on CrossValidated (stats.stackexchange.com). Briefly, they obtain an optimal procedure in the limit of very large matrices. The procedure is very simple, does not require any hand-tuned parameters, and seems to work very well in practice.
They have a nice code supplement here: https://purl.stanford.edu/vg705qn9070
© 2022 - 2024 — McMap. All rights reserved.


