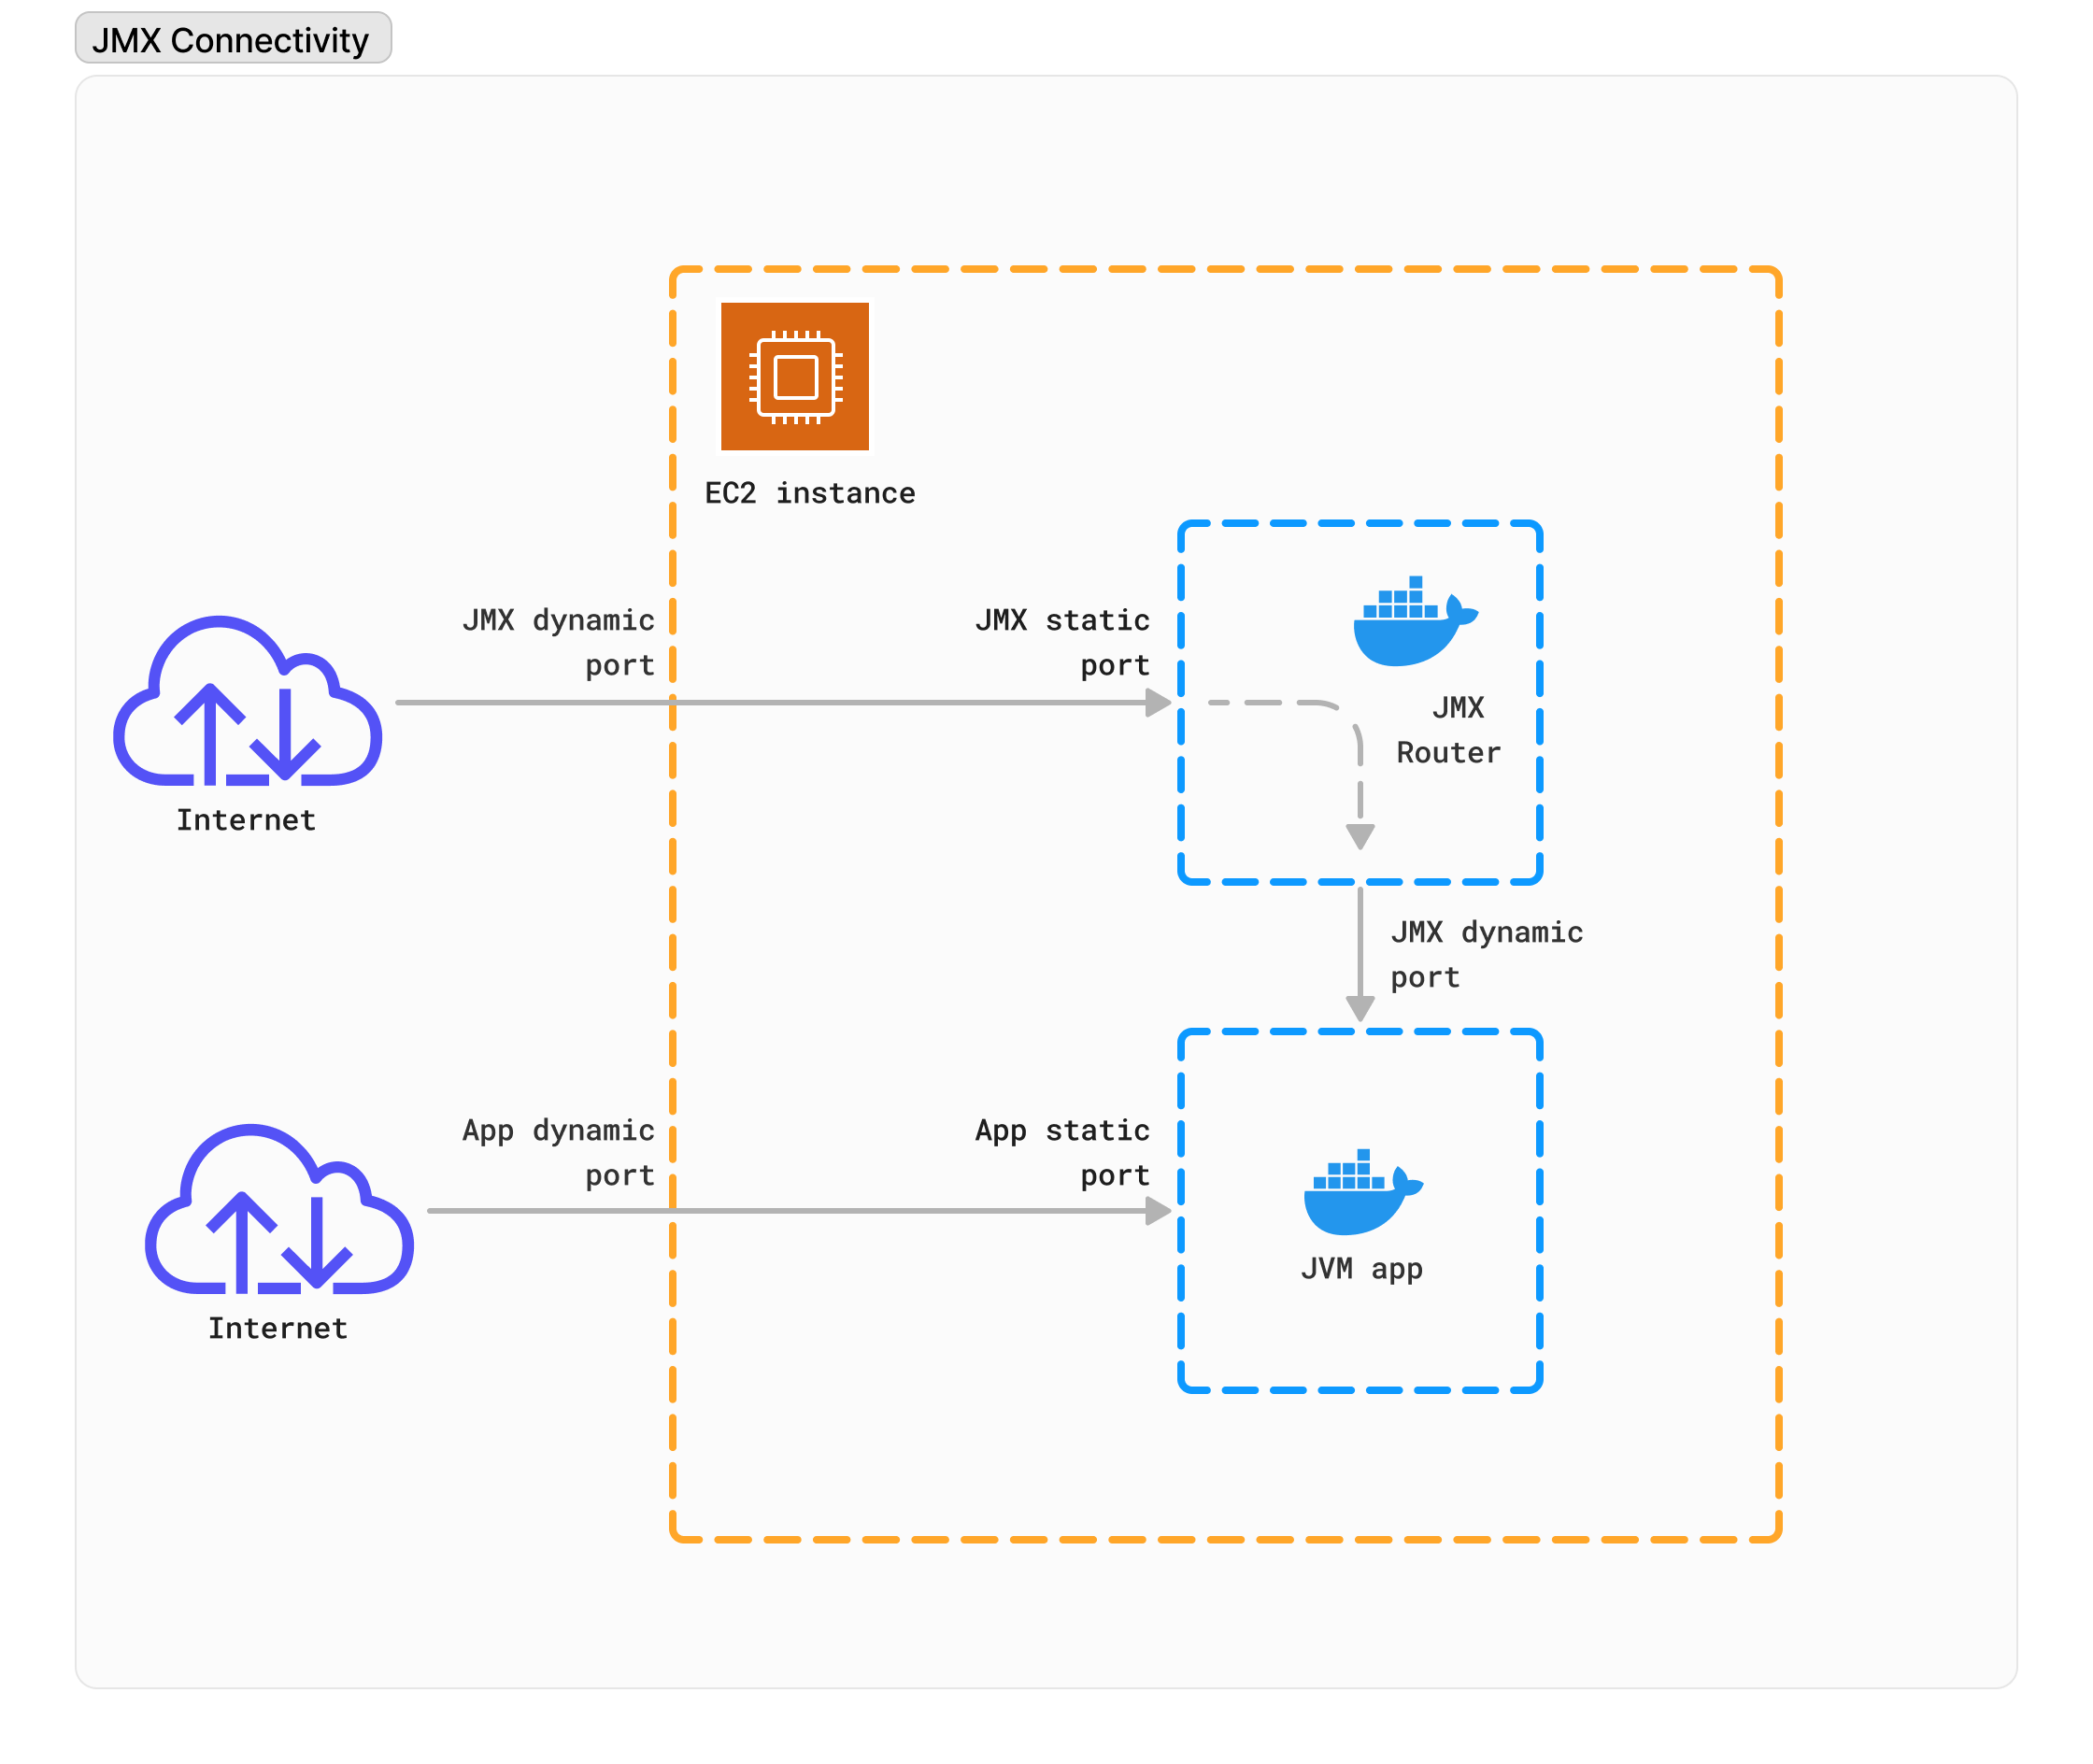
I am trying to remotely monitor a JVM running in docker. The configuration looks like this:
machine 1: runs a JVM (in my case, running kafka) in docker on an ubuntu machine; the IP of this machine is 10.0.1.201; the application running in docker is at 172.17.0.85.
machine 2: runs JMX monitoring
Note that when I run JMX monitoring from machine 2, it fails with a version of the following error (note: the same error occurs when I run jconsole, jvisualvm, jmxtrans, and node-jmx/npm:jmx):
The stack trace upon failing looks something like the following for each of the JMX monitoring tools:
java.rmi.ConnectException: Connection refused to host: 172.17.0.85; nested exception is
    java.net.ConnectException: Operation timed out
    at sun.rmi.transport.tcp.TCPEndpoint.newSocket(TCPEndpoint.java:619)
    (followed by a large stack trace)
Now the interesting part is when I run the same tools (jconsole, jvisualvm, jmxtrans, and node-jmx/npm:jmx) on the same machine that is running docker (machine 1 from above) the JMX monitoring works properly.
I think this suggests that my JMX port is active and working properly, but that when I execute JMX monitoring remotely (from machine 2) it looks like the JMX tool does not recognize the internal docker IP (172.17.0.85)
Below are the relevant (I think) network configuration elements on machine 1 where JMX monitoring works (note the docker ip, 172.17.42.1):
docker0   Link encap:Ethernet  HWaddr ...
      inet addr:172.17.42.1  Bcast:0.0.0.0  Mask:255.255.0.0
      inet6 addr:... Scope:Link
      UP BROADCAST RUNNING MULTICAST  MTU:1500  Metric:1
      RX packets:6787941 errors:0 dropped:0 overruns:0 frame:0
      TX packets:4875190 errors:0 dropped:0 overruns:0 carrier:0
      collisions:0 txqueuelen:0
      RX bytes:1907319636 (1.9 GB)  TX bytes:639691630 (639.6 MB)

wlan0     Link encap:Ethernet  HWaddr ...
      inet addr:10.0.1.201  Bcast:10.0.1.255  Mask:255.255.255.0
      inet6 addr:... Scope:Link
      UP BROADCAST RUNNING MULTICAST  MTU:1500  Metric:1
      RX packets:4054252 errors:0 dropped:66 overruns:0 frame:0
      TX packets:2447230 errors:0 dropped:0 overruns:0 carrier:0
      collisions:0 txqueuelen:1000
      RX bytes:2421399498 (2.4 GB)  TX bytes:1672522315 (1.6 GB)
And this is the relevant network configuration elements on the remote machine (machine 2) from which I am getting the JMX errors:
lo0: flags=8049<UP,LOOPBACK,RUNNING,MULTICAST> mtu 16384
    options=3<RXCSUM,TXCSUM>
    inet6 ::1 prefixlen 128
    inet 127.0.0.1 netmask 0xff000000
    inet6 fe80::1%lo0 prefixlen 64 scopeid 0x1
    nd6 options=1<PERFORMNUD>

en1: flags=8863<UP,BROADCAST,SMART,RUNNING,SIMPLEX,MULTICAST> mtu 1500
    ether ....
    inet6 ....%en1 prefixlen 64 scopeid 0x5
    inet 10.0.1.203 netmask 0xffffff00 broadcast 10.0.1.255
    nd6 options=1<PERFORMNUD>
    media: autoselect
    status: active


Dockerfilewith a properentrypoint.sh, and adocker-compose.ymlfor easy deployment. – Faery